
Stock Market Forecast For The Week Ahead: Growth To Value Rotation Heats Up
US equity markets have had a turbulent week thus far, gyrating between record levels and considerable losses as US Treasury yields creep higher and work to shift the risk landscape. Against the backdrop of an ever-improving US economy, however, the Nasdaq 100, Dow Jones, and S&P 500 may continue higher in the longer-term despite recent weakness. That being said, not all indices are created equal and the high-flying Nasdaq 100, which has dragged markets higher since March 2020, maybe falling out of favor.
NASDAQ 100 PRICE ALONGSIDE QQQ FUND FLOWS
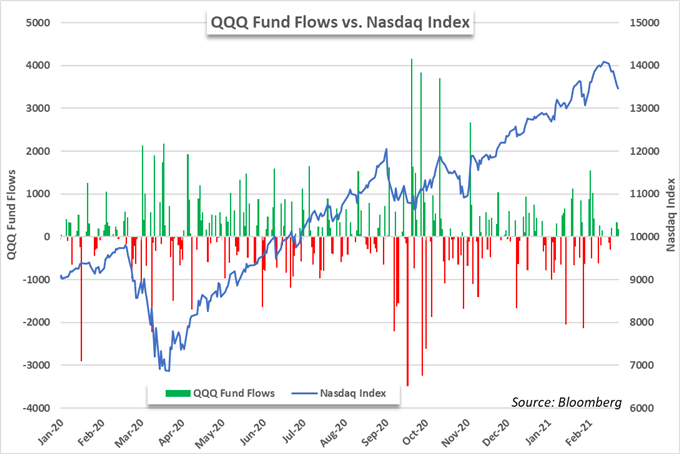
To that end, exchange-traded fund flow data reveals a series of withdrawals from the Nasdaq-tracking QQQ ETF since January 2021. In the year-to-date, QQQ has seen -$780 million leave its coffers despite a simultaneous 4.80% gain in price for the index.
Dominated by stocks like Apple, Microsoft, Amazon, Google and Tesla, the Nasdaq 100 has long been the leader in speculative risk appetite, leaving it especially vulnerable as investors look to reposition their portfolios amid rising risk-free rates. As a result, the stocks that have captivated the market’s attention for months appear to be some of the most vulnerable in the current climate and traders have voiced concern by withdrawing exposure from QQQ.
TRADERS FLOCK TO STOCKS WITH MORE REASONABLE VALUE
On the other hand, beleaguered sectors like energy have had a remarkable start to the year as stocks like Exxon Mobil (XOM) handily outperform new-age high flyers like Tesla (TSLA) in the year-to-date. Elevated economic forecasts have opened the door to higher crude oil prices which has helped propel the XLE energy ETF higher as investors expect improved earnings from many of the previously downtrodden stocks in the sector. Further still, the energy sector was one of the largest losers at the onset of the covid pandemic and many investors may have shied away from exposure as a result.
INVESTORS PILE INTO ENERGY-TRACKING XLE ETF
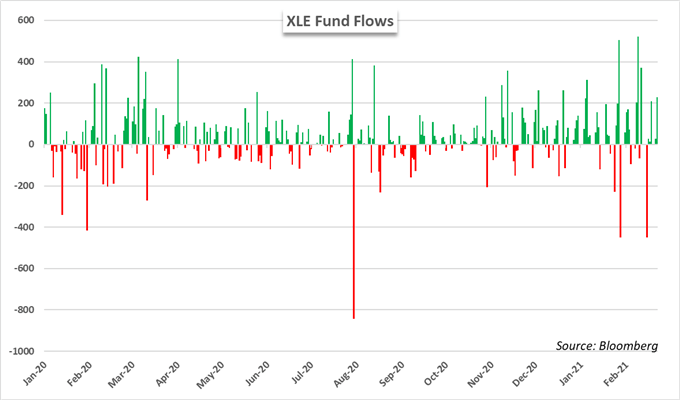
Now that crude has recovered and investors begin to cut exposure to stocks with lofty valuations as Treasury yields tick higher, the energy sector has been a big beneficiary. In the year-to-date, the XLE fund has recorded $2.6 billion in net inflows amidst a 32.50% gain in price during the same period. While energy is just one sector that has outperformed the Nasdaq 100, it is indicative of the gradual uptick in demand for value stocks.
Suffice it to say, price action and fund flow data suggest traders have been engaged in the sectoral rotation for months, a theme highlighted clearly by the recent breakdown in the Nasdaq 100 to Dow Jones ratio.
NASDAQ 100 TO DOW JONES RATIO POSTS ABRUPT DOWNTURN
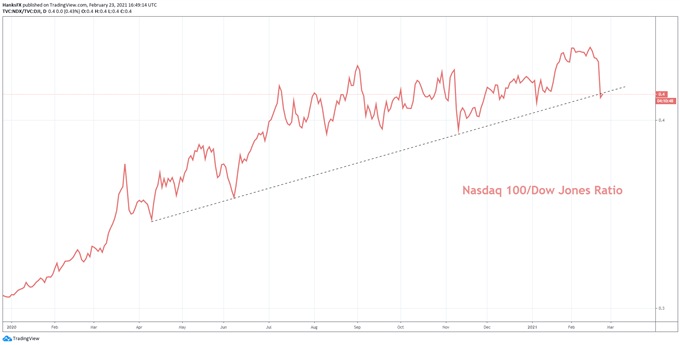
Chart created in TradingView. Ratio used asproxy forgrowth to value stocks
In addition to the abrupt downturn in the Nasdaq to Dow Jones ratio, the recent technical breakdown in the Nasdaq 100might hint the trend will continue in the days ahead. Either way, technology stocks may continue to face pressure as Treasury yields rise and money managers consider the tradeoffs of tech exposure as risk-free rates climb.
Disclosure: See the full disclosure for DailyFX here.


