
Stock Market Crashes: Current Climate Compared To Prior Conditions
The Dow Jones has enjoyed a remarkable rally in the twilight of 2019 which has put it on pace to recoup losses from the year prior despite trade wars, slowing global growth and recession concerns. Evidently, the combined effort of the major central banks has paid off, with various stock markets approaching, or extending beyond, record levels. As the market enters a historically bullish time of year thanks to the Santa Claus Rally and January Effect, many market participants have called for a continuation higher.
But others are hesitant to accept current valuations – fearing the market has become complacent and the risks highlighted earlier in the year may still spark a crash. With that in mind, we can compare the current landscape to the conditions present immediately prior to three of the largest stock market crashes in the last 30 years.
United States Invasion of Kuwait and the 1990 Stock Market Crash
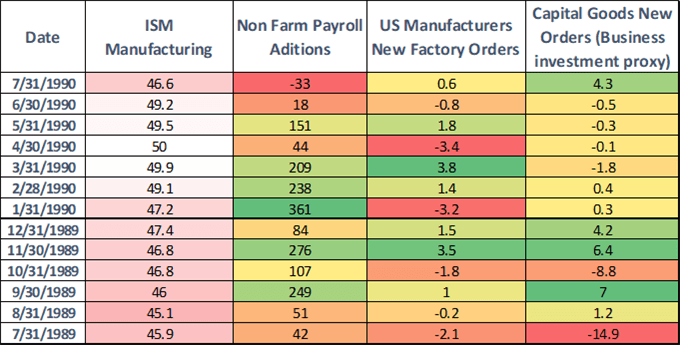
The stock market crash in 1990 followed the US invasion of Kuwait, which saw oil prices surge. In the lead-up, economic measures were unremarkable, but not to the degree that the subsequent market reaction would suggest. Upon the invasion in July 1990, the Dow Jones went on to plummet 18% before October of that same year as oil surged from $16 a barrel to over $40 a barrel.
(Click on image to enlarge)
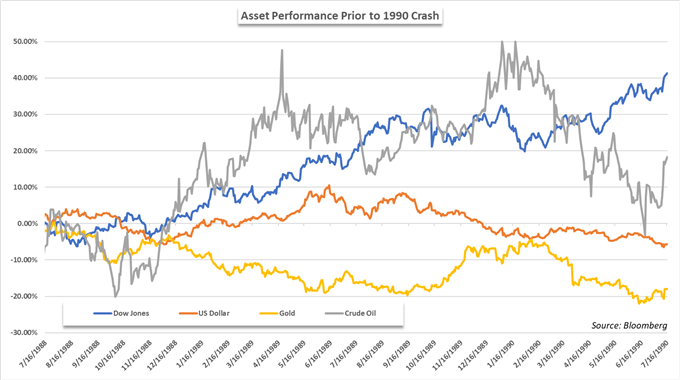
Source: Bloomberg
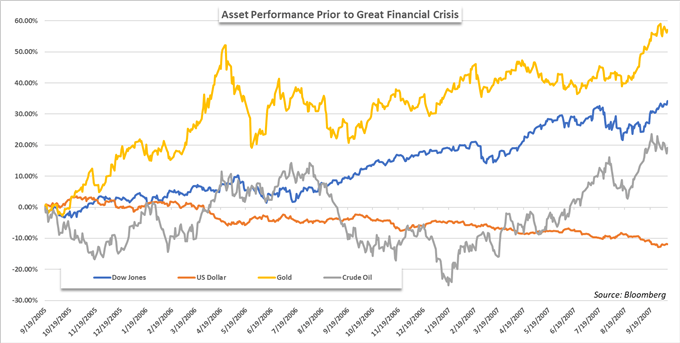
Asset performances at the time were largely within reason which gave market pundits little reason to suspect a looming disaster. The US Dollar and gold were lower for the year and stocks were establishing new all-time highs. Crude oil was beginning to show signs of volatility, but far from the level of volatility that would follow.
(Click on image to enlarge)
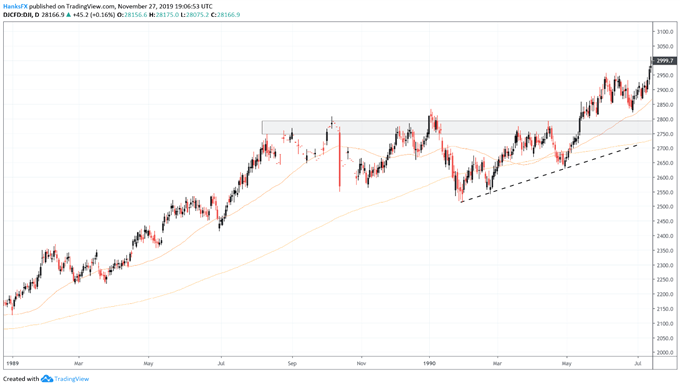
Similarly, simple technical analysis of the Dow Jones at the time reveals little cause for concern. Trading comfortably above its 50 and 200-day moving averages, the Dow Jones delivered a bullish breakout above 2,800 in mid-May 1990 – only to fall beneath 2,400 just 5 months later. From a technical standpoint, one could argue the Dow’s drive above resistance at 2,800 mirrors the Industrial Average’s recent breakout above 27,600.
Dow Jones Price Chart: Daily Time Frame (January 1989 – July 1990) (Chart 1)
(Click on image to enlarge)
Dot-com Crash
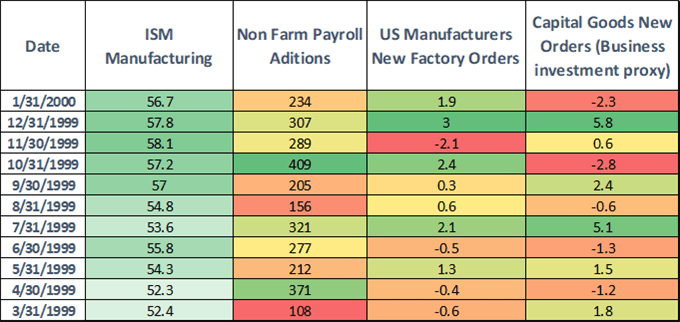
In the mid-1990s to 2000, equity markets would be engrossed with technology stocks, only for them to come crashing down in early 2000. The result saw the Dow Jones trade gradually lower for more than two years until it eventually bottomed in October 2002. In the months prior, data revealed manufacturing was roaring and job-additions were incredibly robust.
(Click on image to enlarge)
Source: Bloomberg
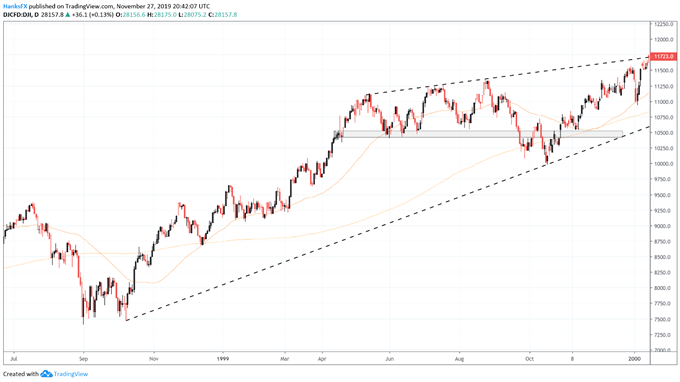
Looking to the technical backdrop at the time, the Dow Jones appeared to be on the brink of a breakout higher. Trading confidently higher since September 1998, the Industrial Average enjoyed a bounty of support beneath and was able to pierce an overhead trendline just days before the market plummeted. Technical traders at the time would have warned of the potential for a false breakout – or the beginning of a new leg higher – depending which side their biases guided them to.
Dow Jones Price Chart: Daily Time Frame (July 1998 – January 2000) (Chart 2)
(Click on image to enlarge)
Great Financial Crisis
Like the Dot-com Crash years before, the housing market crisis saw the Dow Jones derail in spectacular fashion as companies declared bankruptcy and the government turned to taxpayers in an effort to keep large commercial banks afloat. Nevertheless, the burst bubble would wrack the financial world as few were able to predict its arrival.
(Click on image to enlarge)
To be sure, some market pundits were becoming hesitant the gains could go on, well in advance of the eventual turbulence. In an NPR piece posted on July 20, 2007, the author highlights weak earnings from Caterpillar – a global growth bellwether – as the reason for the Dow Jones slipping beneath 14,000, a level it surpassed for the first time ever just days before.
(Click on image to enlarge)

Source: NPR
But opinions were divided as always, and some analysts were convinced the market was experiencing a bout of volatility like any other - even after the cracks had begun to show. In a CNN Money article published on August 9, 2007, analysts offered their view on the market following recent selloffs. “We're in a volatile place," Kiddoo said, "and there's an overreaction to the news and rumors here that's feeding into that volatility."Concerns about credit and the housing market aren't likely to disappear anytime soon, Goldman said. Yet, going forward, the equity market is probably in a better place to absorb the unrest than it was a month ago since many of the stock indexes are well off their 2007 highs. Additionally, the "financial underpinnings of the market remain positive in the long term," Kiddoo said. The next month or so is bound to be choppy, the analysts said, as is typical in August, but stocks could stabilize and recharge for the classic fourth-quarter advance.”
Dow Jones Price Chart: Daily Time Frame (July 2006 – October 2007) (Chart 3)
(Click on image to enlarge)
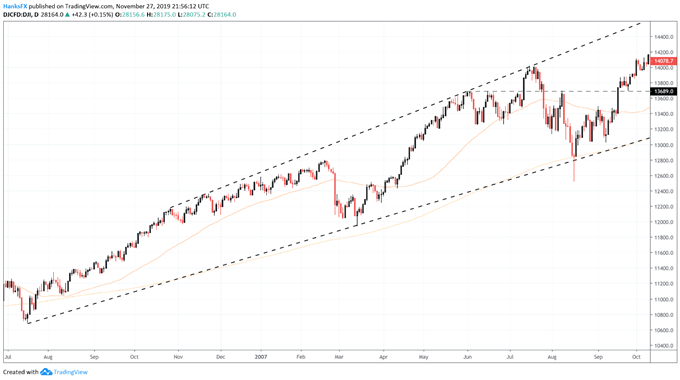
With the benefit of hindsight, we know the Dow Jones would proceed to top in October 2007 before tumbling throughout the fourth quarter and the following year. Despite worsening credit conditions in the months immediately prior to the crash, some analysts remained confident – not willing to lose out on potential gains. Further still, the technical foundation was extended at record highs, but relatively reasonable considering some of the technical pictures the index has painted since. Although concern was warranted, traders pressed on, and a similar sentiment can be seen in the current market.
The Stock Market in 2019 and 2020
The year-to-date has been full of concerns ranging from Brexit, slowing global growth and the ongoing trade war with China. In turn, central banks have worked to combat the headwinds by loosening monetary policy – effectively admitting their domestic economies need a helping hand. Nevertheless, stock markets across the developed world have pressed to lofty levels and equities in the United States have established new highs comfortably.
(Click on image to enlarge)

Source: Business Insider
While many are warning of inflated asset prices, ballooning debt, and an uncertain future, others have doubled down – arguing the advent of monetary easing has opened the door to an entirely new stock market rally that will reach well beyond current levels.
(Click on image to enlarge)

Source: CNBC
Whichever camp you fall into, economic measures reveal a slowing US economy. Whether or not the floor for economic growth has been hit is yet to be seen, but with data from the year-to-date, it is hard to refute the economy is in a weaker position now than it was a year ago when the market was in the middle of a precipitous decline. Nevertheless, it is hard for a profit-seeking investor to argue against stocks while they trade at record highs.
(Click on image to enlarge)
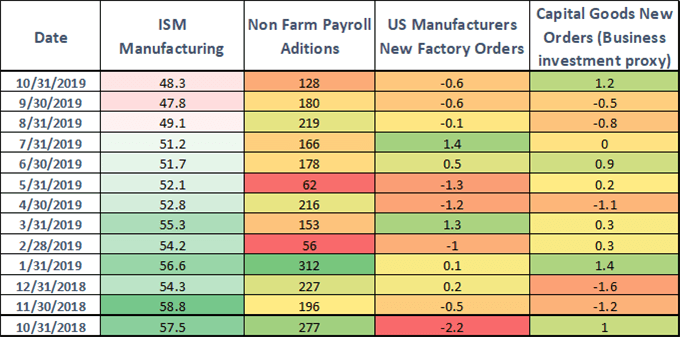
Source: Bloomberg
With that in mind, it is easy to spot similarities between current conditions and past instances of market instability but as is often the case, “time in the market beats timing the market.” Consequently, many traders have discarded warning signals and economic headwinds in favor of latching onto stock’s incredible rally and extracting every available pip. While it can be hard to sit idly by as stocks ascend, traders should be cognizant of the incredibly lofty valuations at which the Dow Jones trades and hedge accordingly.
Dow Jones Price Chart: Daily Time Frame (February 2018 – November 2019) (Chart 4)
(Click on image to enlarge)
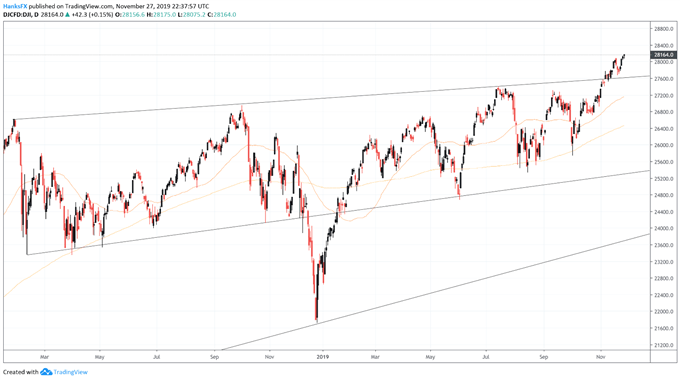
Given the current climate, short-term targets with clear entry and exit points could prove to be a prudent investment strategy for those looking to capture the equity rally despite the uncertainty. Further, still, equity portfolios should also possess exposure to assets with negative correlations – like gold or the US Dollar for example. Therefore, in the event of a sudden shock like the Dot-com bubble or Great Financial Crisis, the damage dealt could be lessened.


