
Stock Chart Topping Signal: Splunk Inc (SPLK)
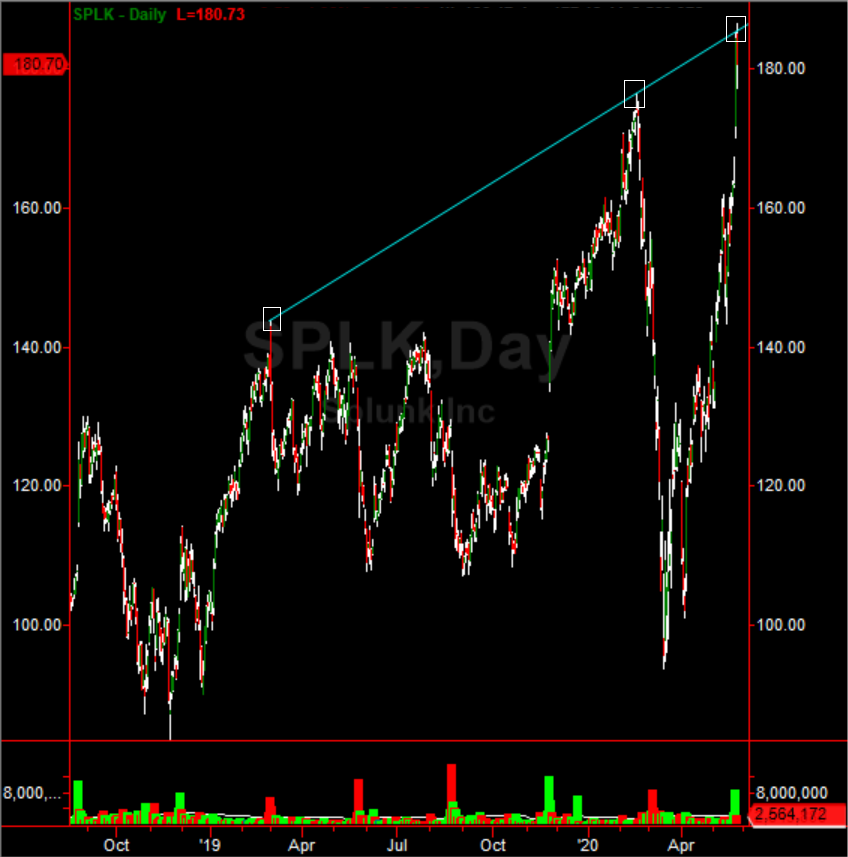
There is a major stock chart-topping signal on Splunk Inc (SPLK). The triggered sell alert on the stock hit after the stock tagged a new all-time high today at $186.47. The trigger occurred after price tagged a major pivot top trend line connecting the high pivot from March 4th, 2019, and February 19th, 2020. If you connect those points the line extends to the high pivot from today. Each of those previous tops was a major pivot high before a large decline. The stock chart-topping signal on Splunk Inc screams a decline of at least 20% in the coming weeks. Note the stock chart below.
Investors and swing traders should look for a pull back on Splunk Inc to $145.00. This will likely occur within the next 4-6 weeks. Whether selling a long position or shorting the stock, both appear to be very wise at these elevated levels with so many extended/topping signals abound.
Disclosure: None.


