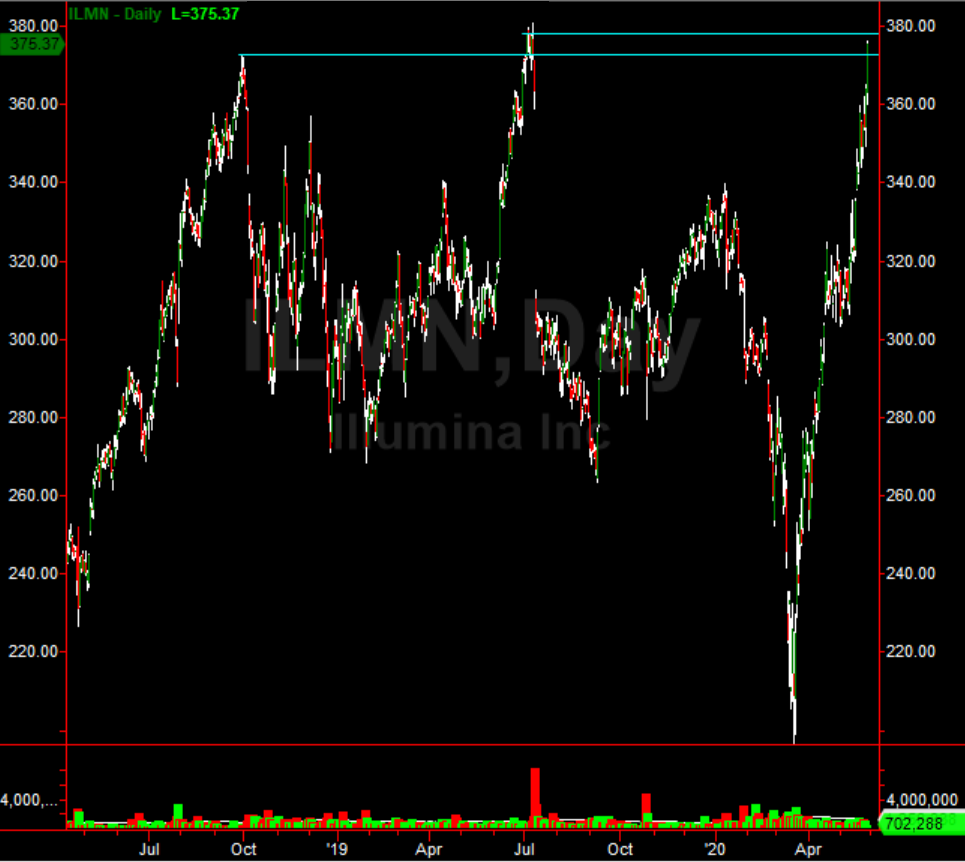
Stock Chart Sell Signal: Illumina Inc (ILMN)
There is a strong stock chart sell signal emerging on Illumina Inc (ILMN). After hitting a low below $200.00 in late March 2020, the stock has soared to $375.00. After crossing $375.00, it has tagged its maximum upside range and within days should see a large drop. The stock chart sell signal is based on a major pivot high from October 2018 and the all-time high in July 2019. The July 2019 high creates an epic double top on the stock. With the technical metrics MACD and RSI screaming overbought, the double top stands to be a highly favored pull back level in the near-term. A pullback to the $335 level is the target and stands as major support. This means that swing traders looking to short Illumina can net a gain of 10% in the coming weeks on the short side.
(Click on image to enlarge)

Disclosure: None.


