
SPX Pivot Point Values For June
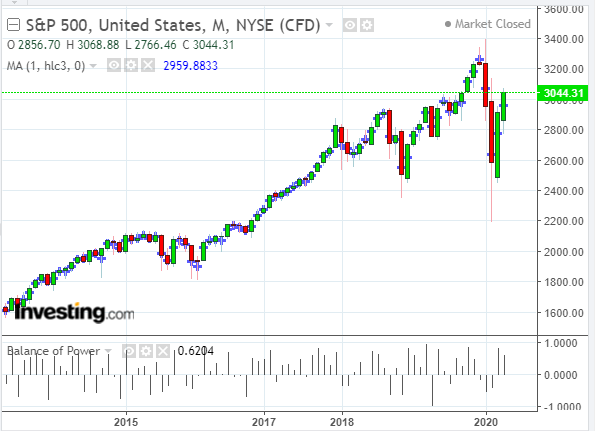
Further to my post of May 25, the SPX didn't quite reach its potential R1 target of 3095.86 for the month of May. Rather, it hit a high of 3068.88 by month's end and was just 24.57 points shy of that level, as shown on the following monthly chart.
However, in my post of May 17, I gave the SPX a 55% chance of moving higher, when its price was 2863.70. Since then, it gained 205.18 points in nine trading days into the end of May.
So, all in all, I'd have to say that the the bulls were a little more than 55% successful in moving this market higher, even though it didn't quite make its R1 target.
JUNE TARGETS
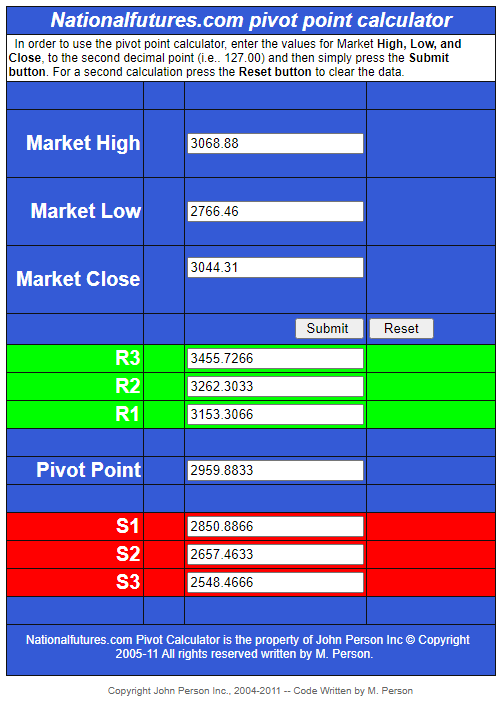
The pivot point support/resistant values/targets for the S&P 500 Index (SPX) for the entire month of June are based on the high/low/close of the May monthly candle, as shown on the following pivot point calculator.
The PP of each monthly candle is depicted as a blue cross on the chart of the SPX below.
You can see, at a glance, where the current price is relative to those...giving an indication as to its relative strength/weakness as the price moves above/below each one in the coming days/weeks/months.
As of Friday's close, it's well above March, April and May's PP and pierced through February's PP of 3067.86. Price has fought through all of 2018, half of 2019, and well over half of 2020's overhead resistance since the March low, with relatively less (and recent) overhead resistance left to overcome.
R1 sits at 3153.3066, which, together with February's PP of 3067.86, will act as near-term resistance, as well as targets.
The closer the SPX gets to its all-time high at 3393.52, the nearer the Balance of Power will reach an overbought condition. However, that does not automatically mean that it will sell off at that point or that the price can't go much higher. Rather, it may just continue to rally more slowly over time.
Near-term support sits at May's PP at 2959.8833. A drop and hold below that level may see price reach S1 at 2850.8866, or lower.
SUMMARY
We may see, either a pause in direction, or some profit-taking on Monday and beyond, as the markets digest the effects of this past week's riots in Minneapolis and St. Paul, and other cities across America...particularly, with respect to the damages caused to many businesses, as they were set to open in June after the COVID-19 pandemic months' long shutdown.
All of my posts (and charts) contain solely my own technical analyses/opinions/observations (which may contain errors or omissions) of a variety of markets and are provided for your ...
more

