
S&P Stirs Near Highs, Russell 2000 Breakout Ahead Of Inflation, FOMC
The run in equities from the lows set last March has outstripped even the wildest expectations for how equities would perform through a global pandemic. While last March was troubling, much of what’s happened since has been to the bewilderment of bears as prices have just continued to punch higher through the recovery.
Of course, there’s a very obvious reason for this, and that’s the brute force accommodation provided by the Federal Reserve to help the US economy grind through this otherwise difficult period. As data has started to show more and more optimism, the big question has become when the Fed might start to scale back some of that accommodation and, as of this writing, there are few signs to indicate that anything is yet on the horizon.
This could change in a week, however, as a really big FOMC rate decision sits on the economic calendar for next Wednesday. Few are expecting any rate hikes or announcements of taper or anything tangible, really. The devil is in the details here, and market participants are likely going to be parsing the details of the Fed’s statement and accompanying press conference for any sign of ‘less loose’ policy on the horizon. What makes this meeting more interesting is the fact that it’s a quarterly meeting, so we’ll also be getting updated forecasts and projections, and this will highlight just how optimistic the Fed is and when the bank may look to start adjusting rates.
At the core of that argument around policy is the prospect of inflation. The saga around inflation in response to stimulus goes back for a decade now, when the Fed was able to embark on multiple rounds of QE in the post-GFC backdrop without yet exposing the American economy to the runaway inflation that many feared it would produce.
When Covid came into the equation last February and March, the Fed threw the kitchen sink at the matter, allaying inflation worries for another day. What the bank did worked, and support was soon in play before stocks went flying into the summer. Along the way, the Fed appeared to try to head-off that worry around inflation, changing their approach to targeting ‘average’ inflation in which they said they’d be more accepting of above-average inflation prints.
Well, those have started to show this year as last month saw a 4.2% read for headline CPI, far beyond the Fed’s 2% target. Another CPI release is due on Thursday and the expectation here is for a 4.7% print. So, while the Fed has said that they feel inflation is transitory and that they’d be willing to tolerate above-target inflation, the question remains as to whether they’re comfortable with this level of inflation along with some of the other peculiarities that have shown in markets such as the volatility around cryptocurrencies or meme stocks.
SETTING UP FOR INFLATION DATA, THEN FED
At this point, equities look to be fairly optimistic around the drivers sitting ahead. The S&P 500 continues to stir just under recently-established all-time-highs. But, perhaps a better barometer of that optimism is showing in small cap stocks, represented by the Russell 2000 index a little lower.
In the S&P 500, the index is set up for bullish breakout potential, currently showing horiziontal resistance around the all-time-high; coupled with a rising trendline represented by the higher-lows that have built over the past couple of weeks.
Such formations are often approached with the aim of bullish continuation, and this would keep the door open for fresh all-time-highs ahead of or, possibly even, around the release of inflation data on Thursday. With an expectation for 4.7%, we may even see that topside drive on a print above 4% as the bar is set incredibly high.
S&P 500 DAILY PRICE CHART
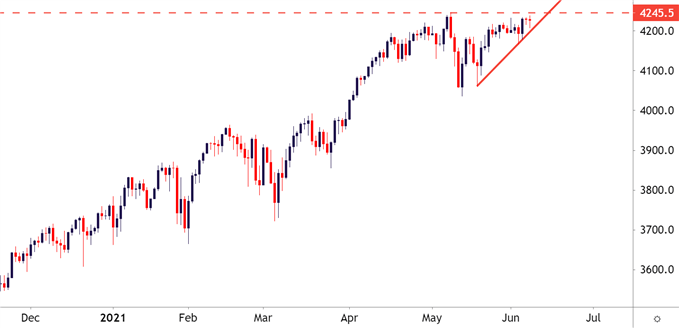
Chart prepared by James Stanley; SPX500 on Tradingview
RUSSELL 2000 BREAKOUT TO FRESH TWO-MONTH-HIGHS
Perhaps a better barometer of that optimism is in an area that’s been less loved of recent, and that’s small cap stocks.
Small cap companies are generally more vulnerable to interest rate hikes, owed to their smaller sizes and lower credit ratings. But, in a strong environment small caps can lead as there’s also higher potential growth rates and significantly more room to grow. And while all of the Dow, S&P 500 and Nasdaq 100 have all blasted through to fresh all-time-highs in early-May, the Russell 2000 has not yet: The March high still lurks above as the all-time-high.
This can set up a fairly interesting scenario for both bulls and bears through the next week of drivers.
RUSSELL 2000 DAILY PRICE CHART (IWM)
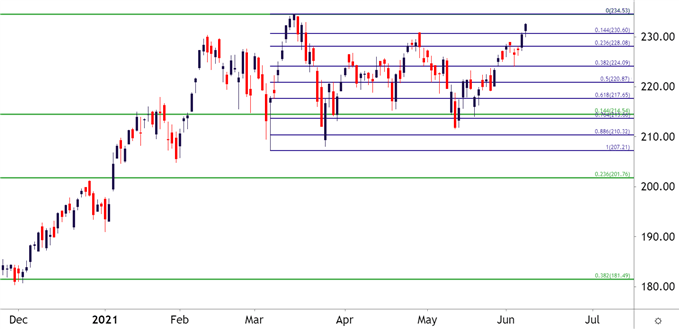
Chart prepared by James Stanley; Russell 2000 (IWM) on Tradingview
Disclosure: See the full disclosure for DailyFX here.


