
S&P, Nasdaq Posture At All-Time-Highs: What's Holding Them Back?
Global stock markets remain strongly bid as hopes for a coronavirus vaccine drive prospects of a stronger recovery in 2021. This as at least somewhat offset by the near-term item of rising coronavirus cases, hospitalizations and deaths that’s being seen in many different spots in the Western World. Here in New York, we’re seeing more restrictions by the day and fear remains of a broader-based lockdown should current measures not take effect. But, that bad news has seemed to matter little as the longer-term projection appears to be more bright: And there’s a possible light at the end of the tunnel for some point in 2021.
There’s another item of concern and this may be a more pressing matter, at least for now, in US equity markets, and that’s the potential for another stimulus deal.
Markets have continued to rally through the past eight months of the pandemic largely because of outsized governmental support. Some of this support is set to expire at the end of the year; and should Congress fail to come to a deal on that next stimulus package, we could see some actual economic destruction beginning to filter-through from that failure.
There’s little expectation that a deal won’t inevitably happen: The bigger matter is one of size, and this is where the political volleyball comes into play. With the GOP retaining the Senate, the Republican party continues to have a significant say in how that stimulus deal is ultimately built. The Democrats, controlling both the House and, as of next year, the White House, want to see a larger deal than what Republicans are willing to sign off on. There seems little in-play that can break that impasse, at least for now, and this is likely what’s holding stocks back from breaking out to fresh all-time-highs, even with multiple covid vaccines now in-play.
In the Nasdaq 100, the leader of US equity indices from the March low into September trade, prices have pushed right back to the prior September high, taken from around the 12,466 level. We did see a bit of penetration above this price yesterday, albeit temporarily, after which prices pushed right back to that level.
NASDAQ 100 DAILY PRICE CHART
(Click on image to enlarge)
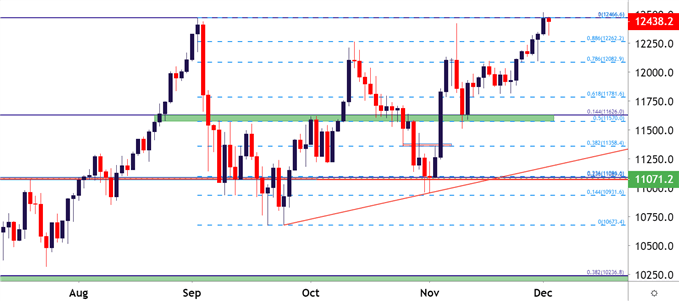
Chart prepared by James Stanley; Nasdaq 100 on Tradingview
COVID VACCINES AND FASTER RECOVERIES
While there is a significant item of positivity on the back of this covid vaccine news, for traders, there’s another matter of interest and that’s FOMC policy.
One of the clear takeaways so far since covid vaccine news began populating the headlines on November 9th, is the continued rise in US Treasury Yields. To be sure, there’s little expectation that the Fed is going to hike anytime soon. But – they may have to hike sooner than initially expected, which was around 2023 or 2024.
If there is a faster return to normal, there’s also the prospect of a faster return with inflation, which could force the Fed’s hand to hike rates before that 2023/2024 window. This, ultimately, could end up becoming a restraint to stocks but at this stage, it may not be as large of a factor as Congress coming together on a stimulus package that could help to address some of the near-term risks.
On the bullish side of stocks – there is backdrop for such in the S&P 500. Similarly, the index is posturing around an all-time-high, although in the S&P, that fresh high came into play on November 9th, the day of Pfizer’s announcement of a drug-carrying a 90% efficacy. That high was touched yesterday, helping to substantiate an area of horizontal resistance. But, on the other side, buyers have been showing more and more aggression in supporting the bid, helping to produce a bullish trendline.
Collectively, this produces an ascending triangle formation- which will often be approached with the aim of bullish breakout potential. This is driven by the thought that the increasing aggression from bulls will, eventually, allow for a topside break through the horizontal resistance that’s so far constrained the bullish theme.
Given the fact that additional positive reports around covid vaccines, after the Pfizer announcement, have yet to produce much in the realms of fresh highs for stocks – one can surmise that the big factor of importance here is the stimulus package that Congress hasn’t yet agreed upon.
S&P 500 FOUR-HOUR PRICE CHART
(Click on image to enlarge)
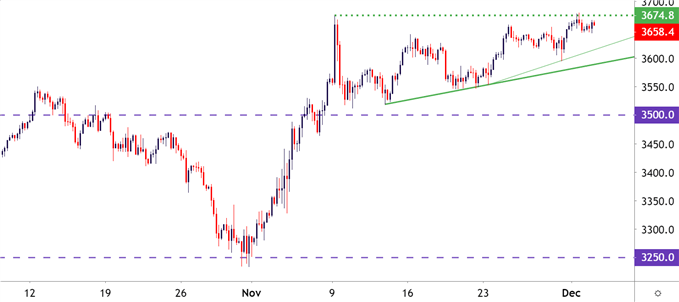
Chart prepared by James Stanley; SPX500 on Tradingview
Disclosure: See the full disclosure for DailyFX here.


