
S&P 500 Snapshot: Seesaw Week, Ending Up 15.1% YTD
The S&P seesawed this week amid trade talk, ending just 2% below its all-time high. The index was down 0.16% from Thursday and up 0.47% from last Friday.

The U.S. Treasury puts the closing yield on the 10-year note at 2.09%, which is still inverted - the 1-month note is at 2.23%, though the 20- and 30-year notes are at 2.38% and 2.59%, respectively.

Here's a snapshot of the index going back to October 2009.

A Perspective on Drawdowns
Here's a snapshot of record highs and selloffs since the 2009 trough.

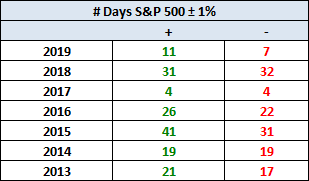
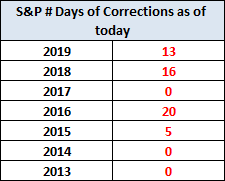
Here's a table with the number of days of a 1% or more change in either direction and the number of days of corrections (down 10% or more from the record high) going back to 2013.
Here is a more conventional log-scale chart with drawdowns highlighted.

Here is a linear scale version of the same chart with the 50- and 200-day moving averages.

A Perspective on Volatility
For a sense of the correlation between the closing price and intraday volatility, the chart below overlays the S&P 500 since 2007 with the intraday price range. We've also included a 20-day moving average to help identify trends in volatility.


