S&P 500 Snapshot: Down 15% Year-To-Date
The S&P 500 spent another week with more losses than gains, but it at least ended the week up 2.39% from Thursday. The index is down 15.57% year-to-date and is 16% below its record close.

The U.S. Treasury puts the closing yield on the 10-year note as of May 13 at 2.93%, which is above its record low (0.52% on Aug. 4, 2020). The 2-year note is at 2.61%. See our latest Treasury Snapshot here.

Here's a snapshot of the index going back to 2012.

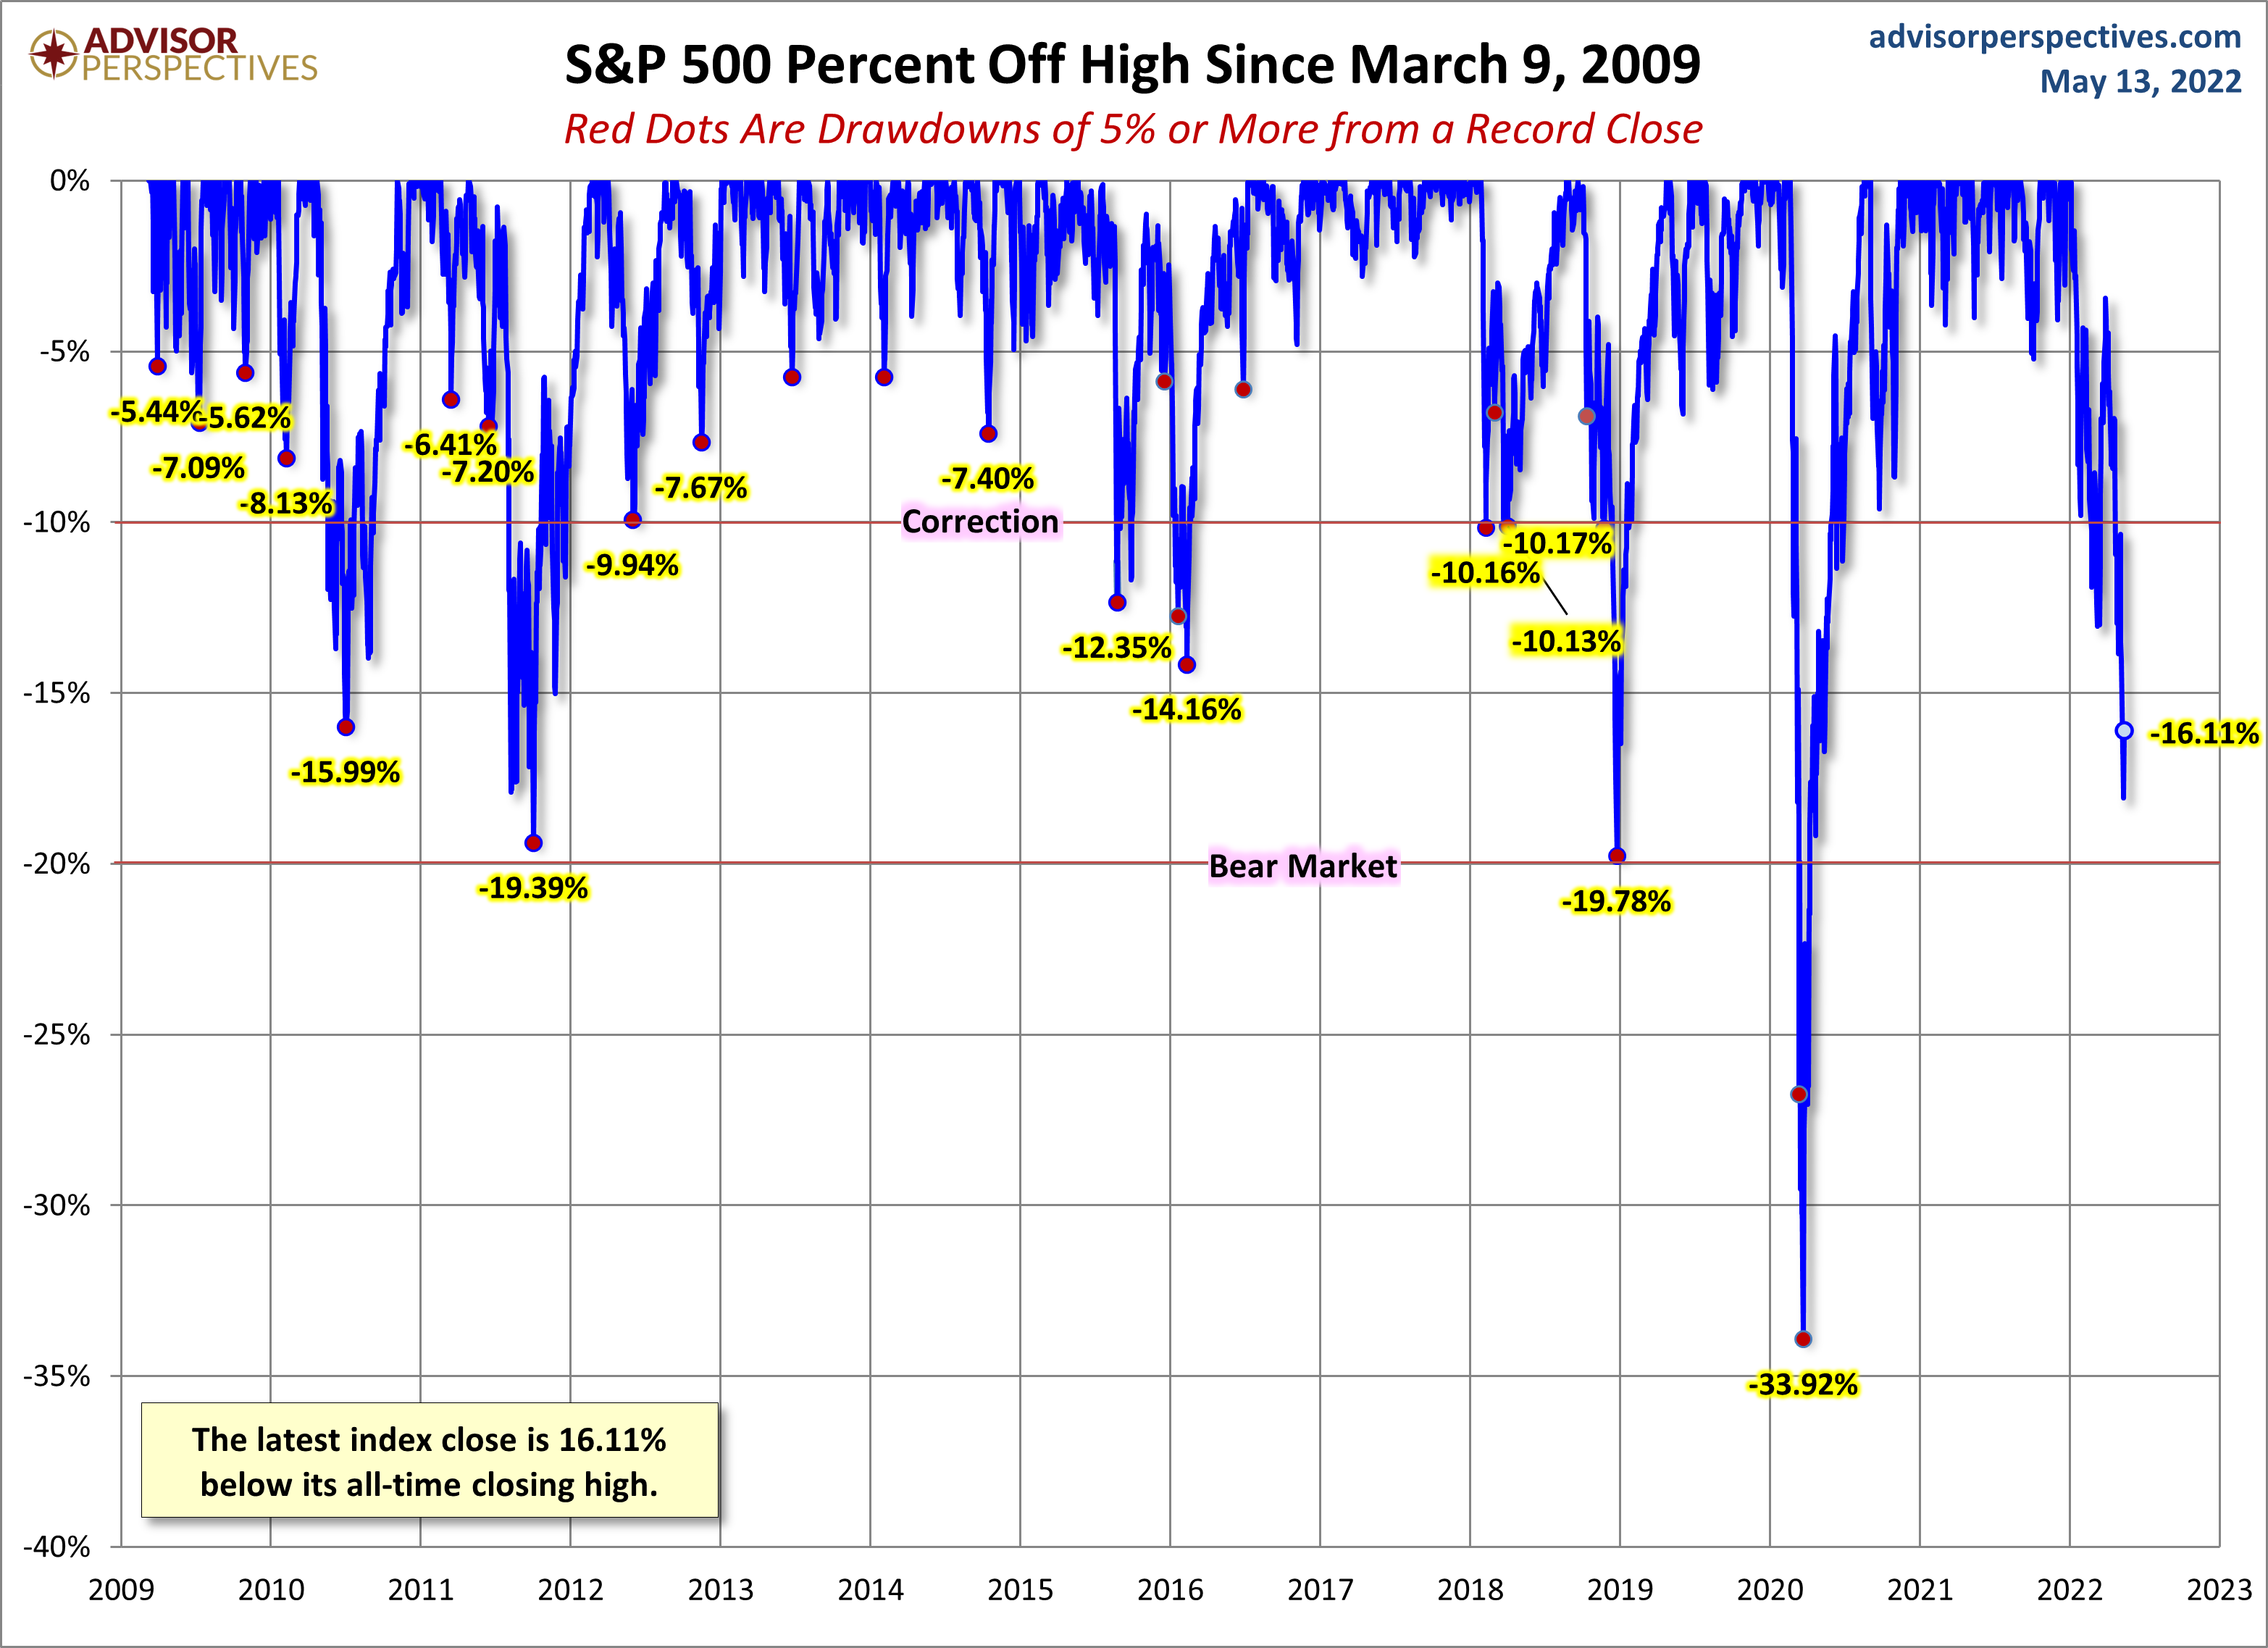
A Perspective on Drawdowns
Here's a snapshot of record highs and selloffs since the 2009 trough. Note the recent selloffs in 2022.
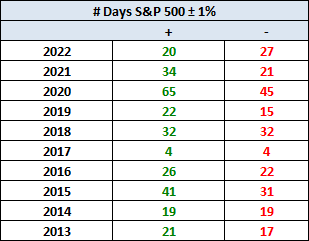
Here's a table with the number of days of a 1% or more change in either direction, and the number of days of corrections (down 10% or more from the record high) going back to 2013.

Here is a more conventional log-scale chart with drawdowns highlighted.
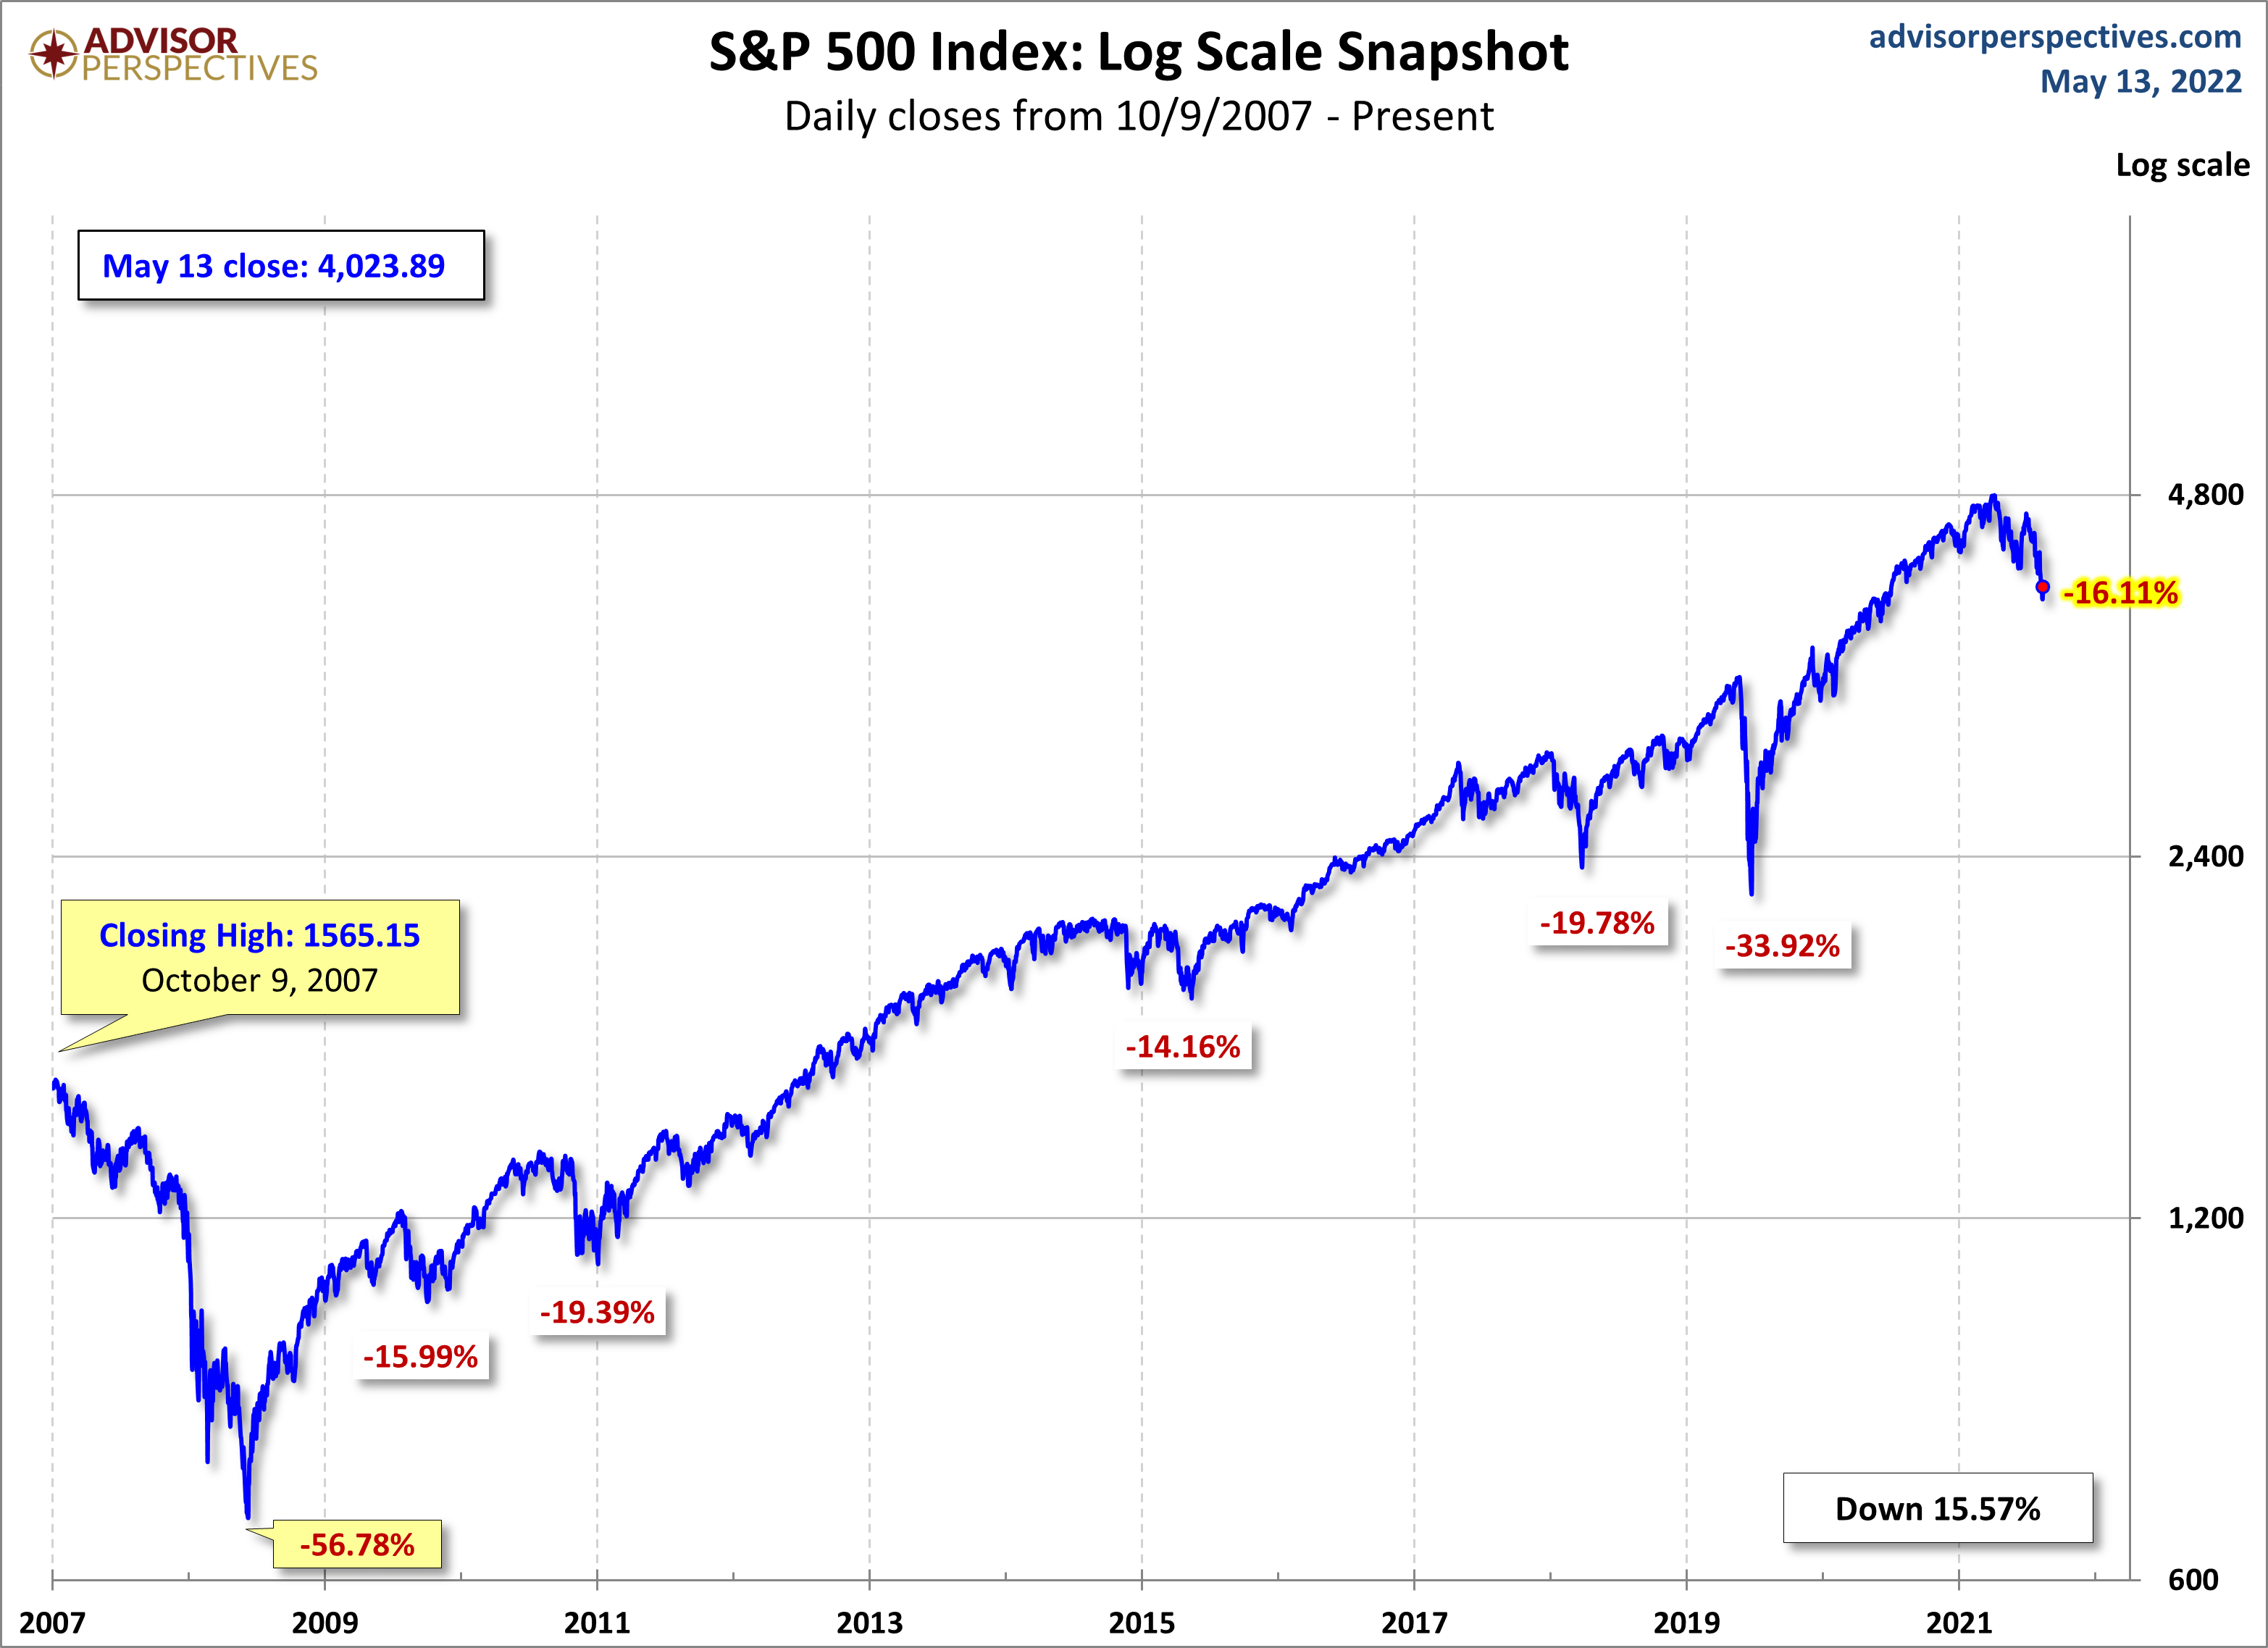
Here is a linear scale version of the same chart with the 50- and 200-day moving averages.

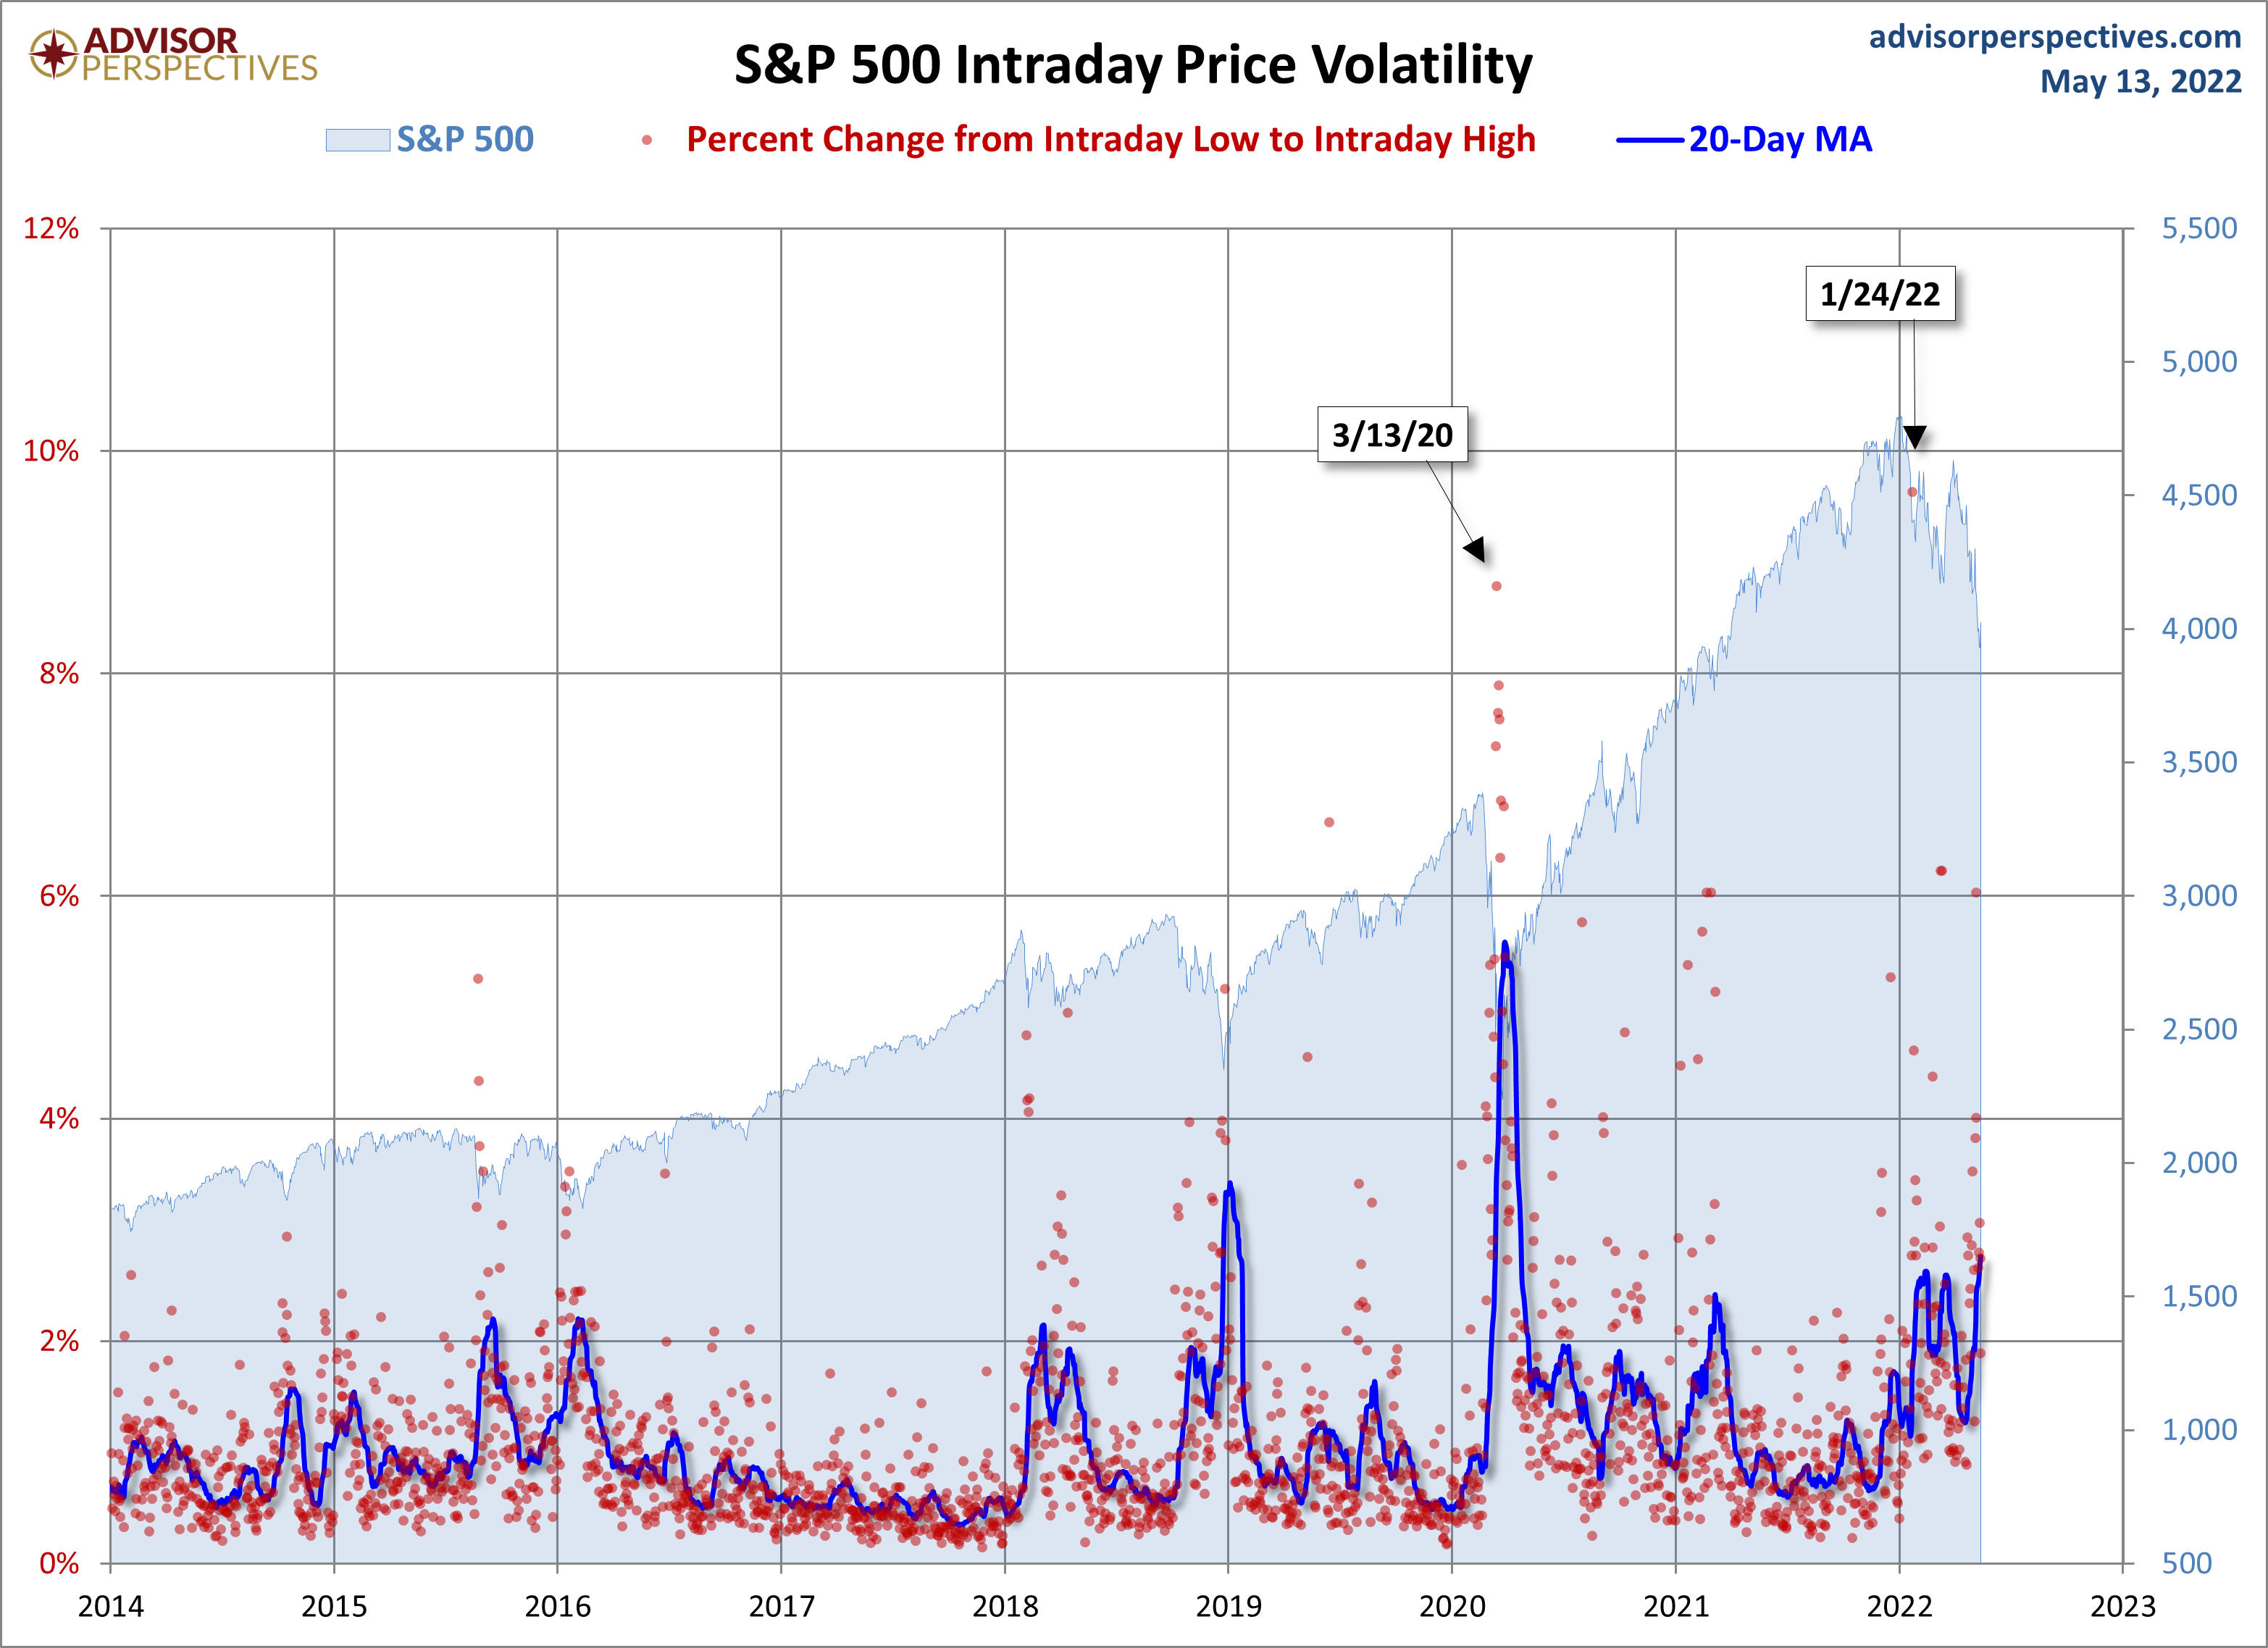
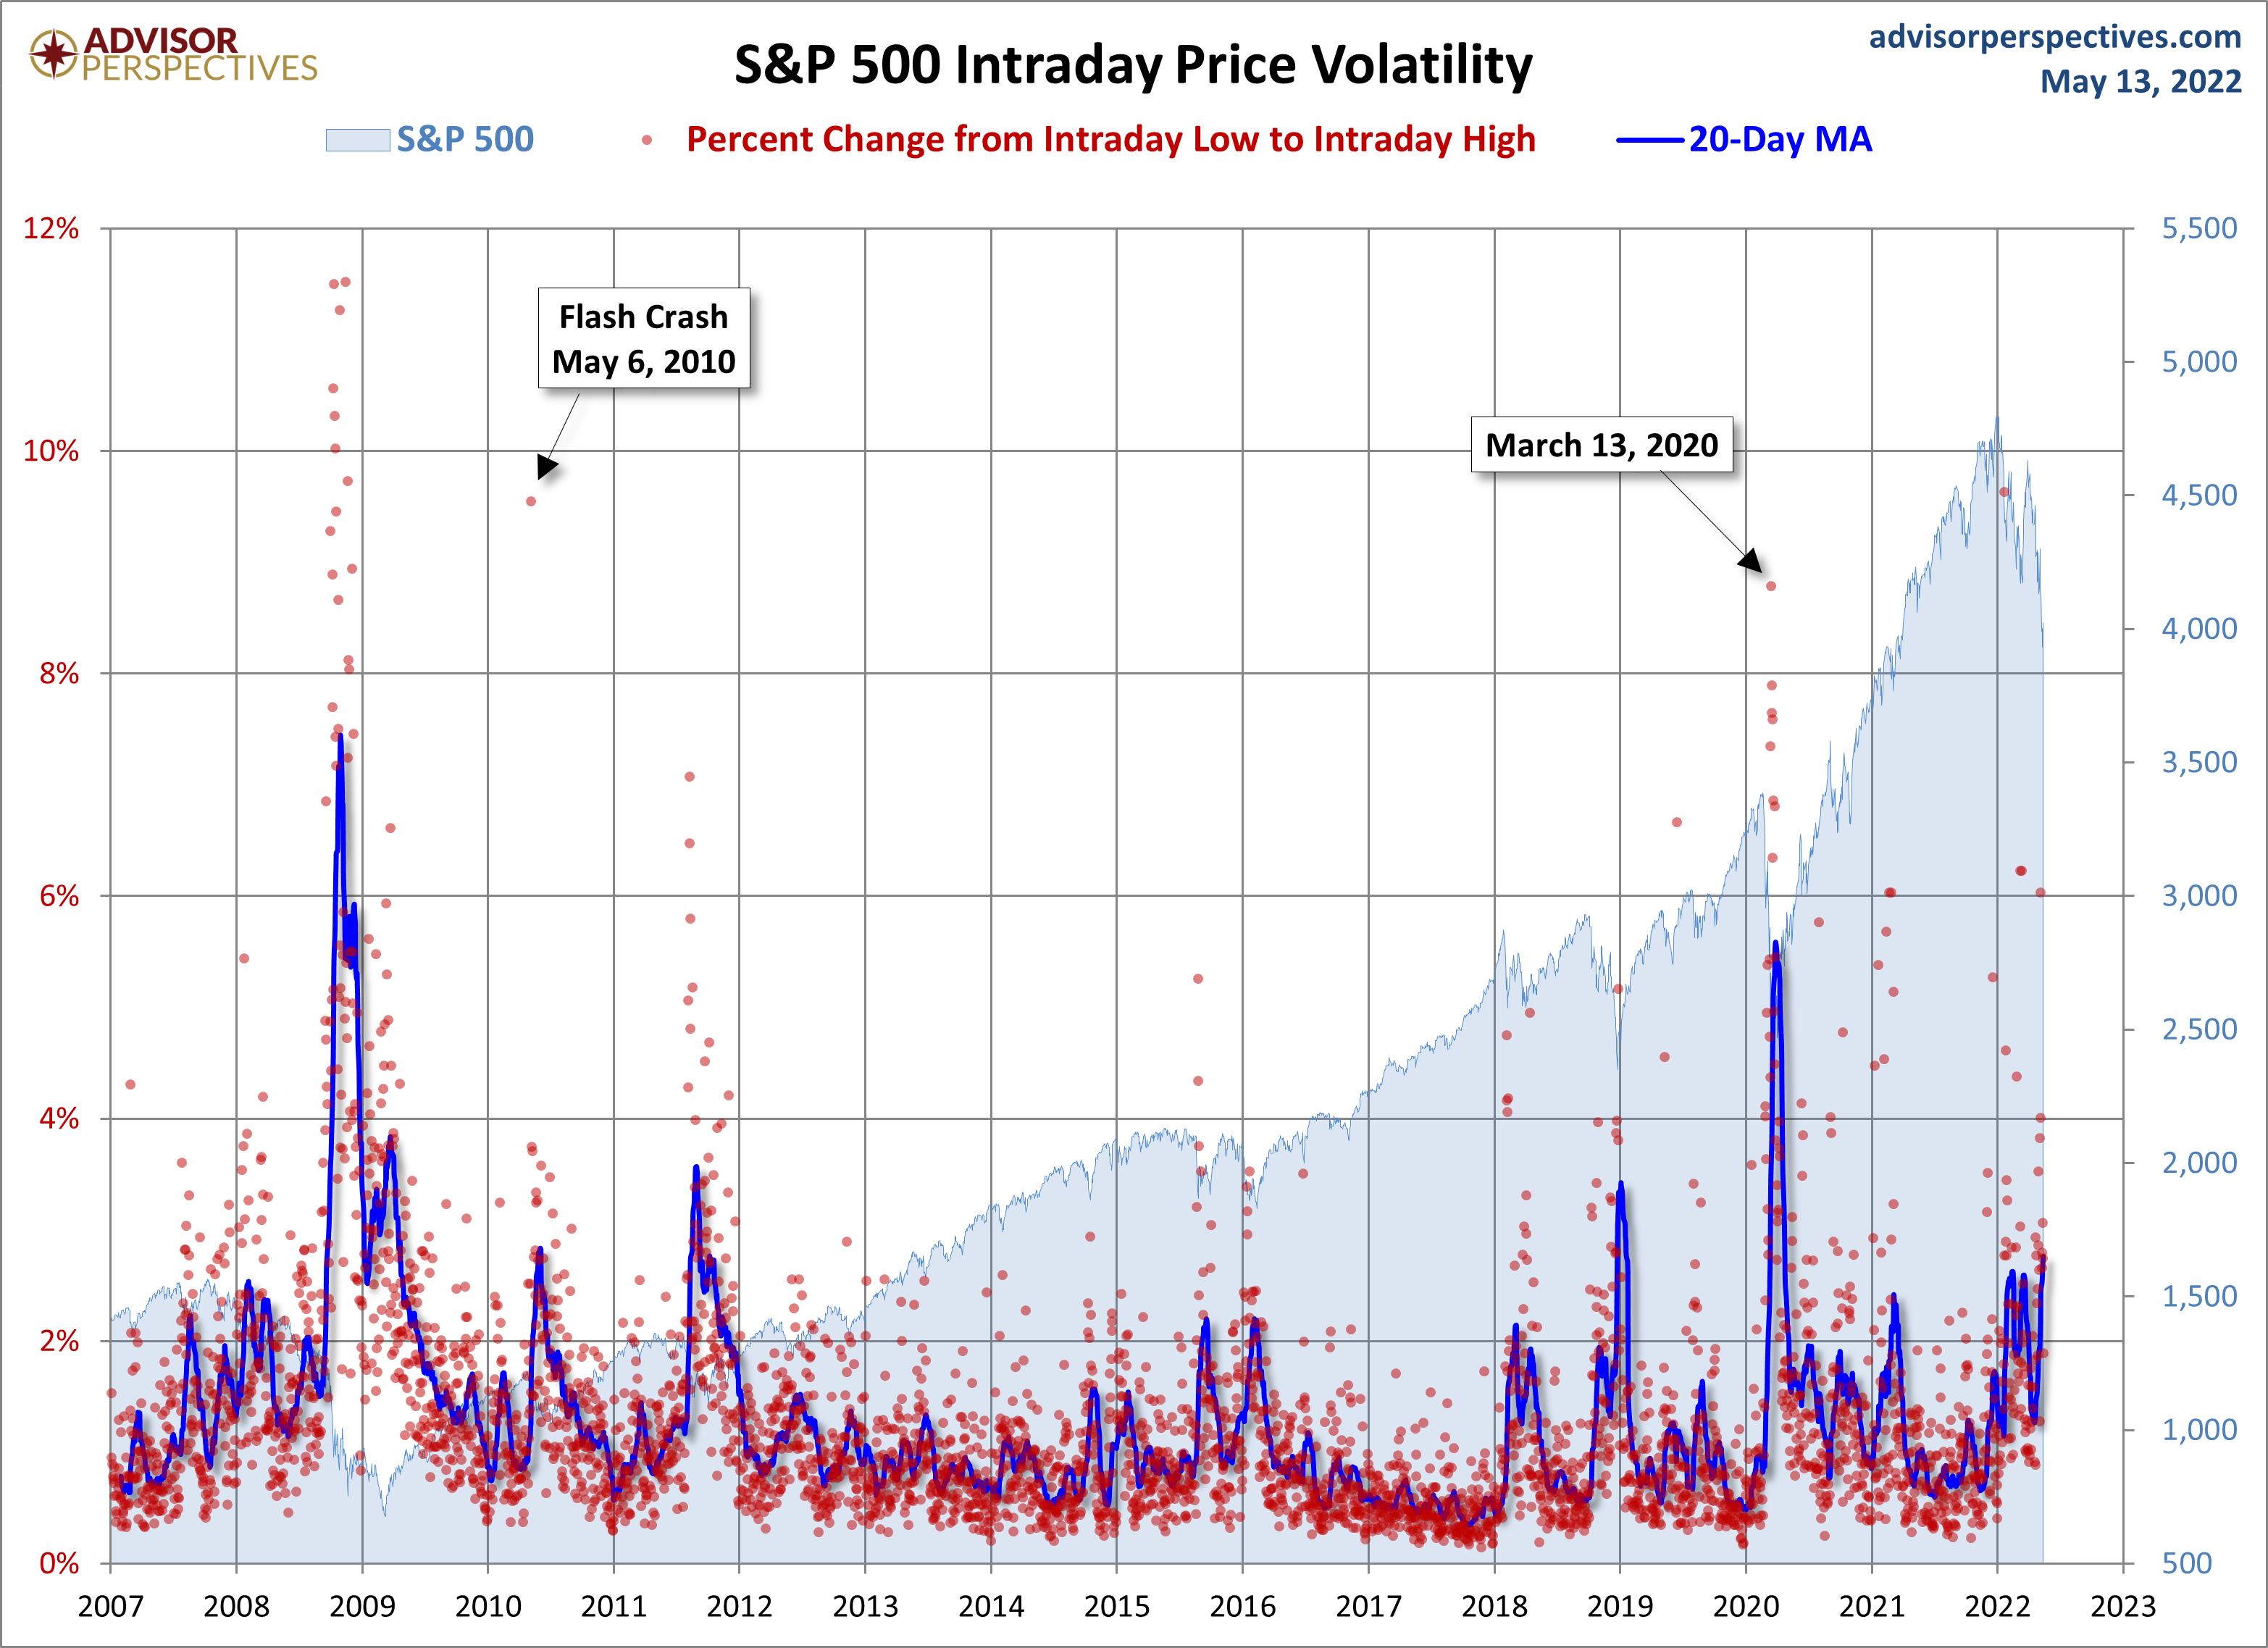
A Perspective on Volatility
For a sense of the correlation between the closing price and intraday volatility, the chart below overlays the S&P 500 since 2007 with the intraday price range. We've also included a 20-day moving average to help identify trends in volatility.
Here's another look, but a slightly more recent look at volatility since 2014.