
Stock prices near record levels again, but will the uptrend continue?
Tuesday’s trading session brought more uncertainty for the stock market, with the S&P 500 index rebounding from the 5,250 level and closing 0.15% higher. Today, futures contracts are pointing to a 0.3% higher open for the index, suggesting an attempt to break above a short-term trading range. Investor sentiment didn’t change following the ADP Non-Farm Employment Change release, which was lower than expected at +152,000.
Last Friday, stock prices bounced from their new local low, and the index got back above the crucial 5,250 level. On Monday, I noted that “the market may see more uncertainty ahead of a series of economic data this week. The most likely scenario is more consolidation and sideways trading.”
In my forecast for June, I wrote “For the last three months, the S&P 500 index has been fluctuating along new record highs, above the 5,000 level which was broken in February. It looks like a consolidation within a long-term uptrend, but it may also be a topping pattern before some meaningful medium-term correction. What is it likely to do? As the saying goes, 'the trend is your friend', so the most likely scenario is more advances in the future.
However, a negative signal would be a breakdown below the 5,000 level. That would raise the question of a deeper correction and downward reversal. I think that the likelihood of a bullish scenario is 60/40 - a downward reversal cannot be completely ruled out. The market will be waiting for more signals from the Fed about potential interest rate easing, plus, at the end of the month, the coming earnings season may dictate the market moves.”
Investor sentiment worsened last week, as indicated by the AAII Investor Sentiment Survey last Wednesday, which showed that 39.0% of individual investors are bullish (a decrease from the previous week's reading of 47.0%), while 26.7% of them are bearish. The AAII sentiment is a contrary indicator in the sense that highly bullish readings may suggest excessive complacency and a lack of fear in the market. Conversely, bearish readings are favorable for market upturns.
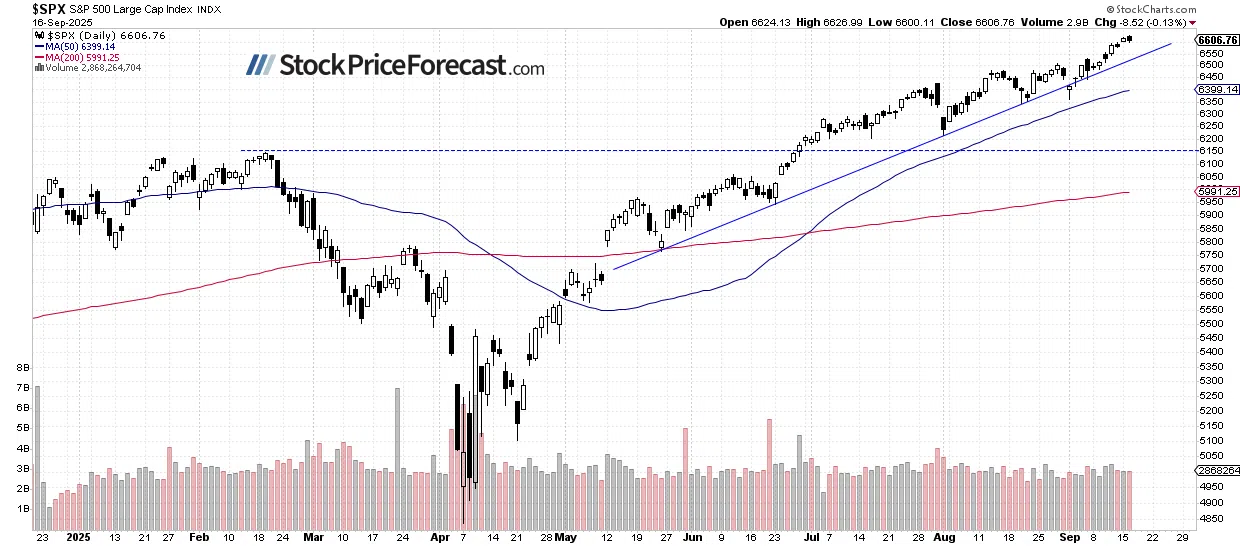
The S&P 500 remained near the 5,300 level yesterday, as we can see on the daily chart.
(Click on image to enlarge)

Nasdaq 100 Also Going Sideways
Quoting from Monday, “On May 23, the technology-focused Nasdaq 100 index reached a new record high of 18,907.54, and last Friday, it was as low as 18,189.78, which means a 3.8% downward correction in a little more than a week. Was it enough to spur another record-breaking rally? It’s hard to say – the market may see more uncertainty this week.”
Today, the Nasdaq 100 is expected to open 0.5% higher, likely breaking above Monday's and Tuesday’s trading range.
(Click on image to enlarge)

VIX Is Still Close to 13
The VIX index, also known as the fear gauge, is derived from option prices. In late March, it was trading around the 13 level. However, market volatility led to an increase in the VIX, and on April 19, it reached a local high of 21.4 - the highest since late October, signaling fear in the market. Recently, it was declining again, and on May 23, it reached its lowest point since November 2019 at 11.52. Yesterday, it remained close to the 13 level despite rebounding above 14 recently.
Historically, a dropping VIX indicates less fear in the market, and rising VIX accompanies stock market downturns. However, the lower the VIX, the higher the probability of the market’s downward reversal.
(Click on image to enlarge)

Futures Contract Trading Above 5,300
Let’s take a look at the hourly chart of the S&P 500 futures contract. On May 23, it pulled back from a new record high of around 5,368 and fell by almost 100 points before rebounding up to around 5,340. Since then, it has been consistently declining, reaching a low of around 5,206 on Friday. However, it rebounded above 5,300 again. This week, it’s been quite volatile but slowly creeping higher. The resistance level is at 5,340-5,360, and the support is at 5,280-5,300.
(Click on image to enlarge)

Conclusion
Wednesday’s trading session is about to open higher for the S&P 500 index, which may break the 5,300 level; however, it’s hard to say if the market will get near its May 23 record high of 5,341.88.
Yesterday, I noted “The market may see more short-term uncertainty, but a deeper correction now seems less likely.” This still seems very true. The important ADP number release wasn’t a game-changer, and the market will be waiting for the ISM Services PMI at 10:00 a.m. and the Bank of Canada Rate Statement announcement at 9:45 a.m.
For now, my short-term outlook remains neutral.
Here’s the breakdown:
- The S&P 500 is likely open higher in an attempt to breaking above a short-term trading range.
- On Friday, stock prices were the lowest since early May before rebounding and retracing most of the declines.
- In my opinion, the short-term outlook is neutral.
More By This Author:
Stocks: Will A New Record Follow Friday’s Rebound?Stocks: Dip-Buying Opportunity Or Trap?
Are Stocks Ready For A Deeper Correction?


Comments
Log in or sign up to join the conversation.