
S&P 500 September 2019 Update: Primary Trend Indicator
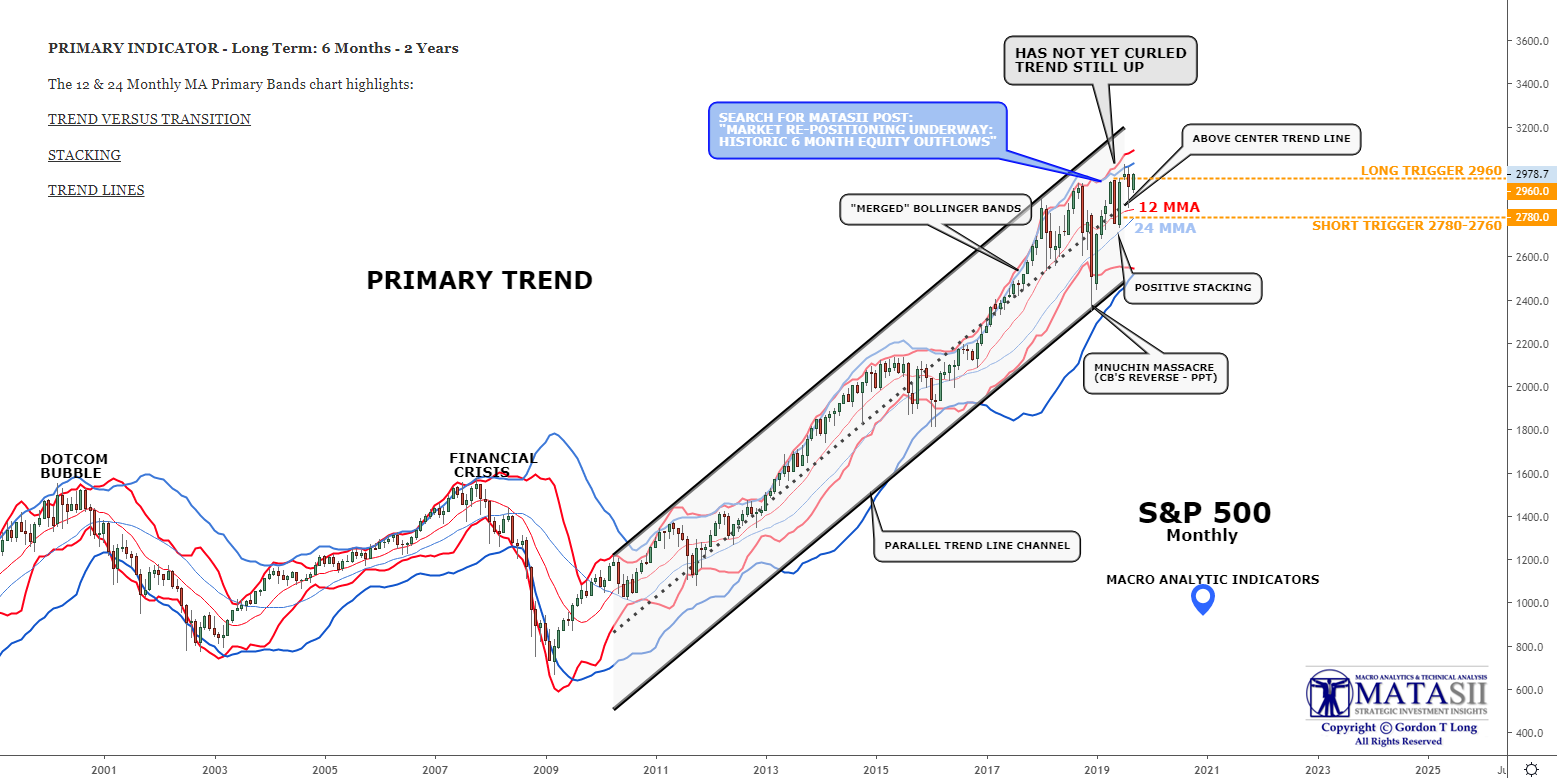
The MATASII Macro Analytic Primary Indicators are still in an upward trend and as of 09-09-19, no violations have as yet occurred.
- The Primary Indicators for the S&P 500 are still giving a positive market bias despite market turbulence.
- We have broken our 2960 Trigger to the upside suggesting we have a near term move to the upside ahead.
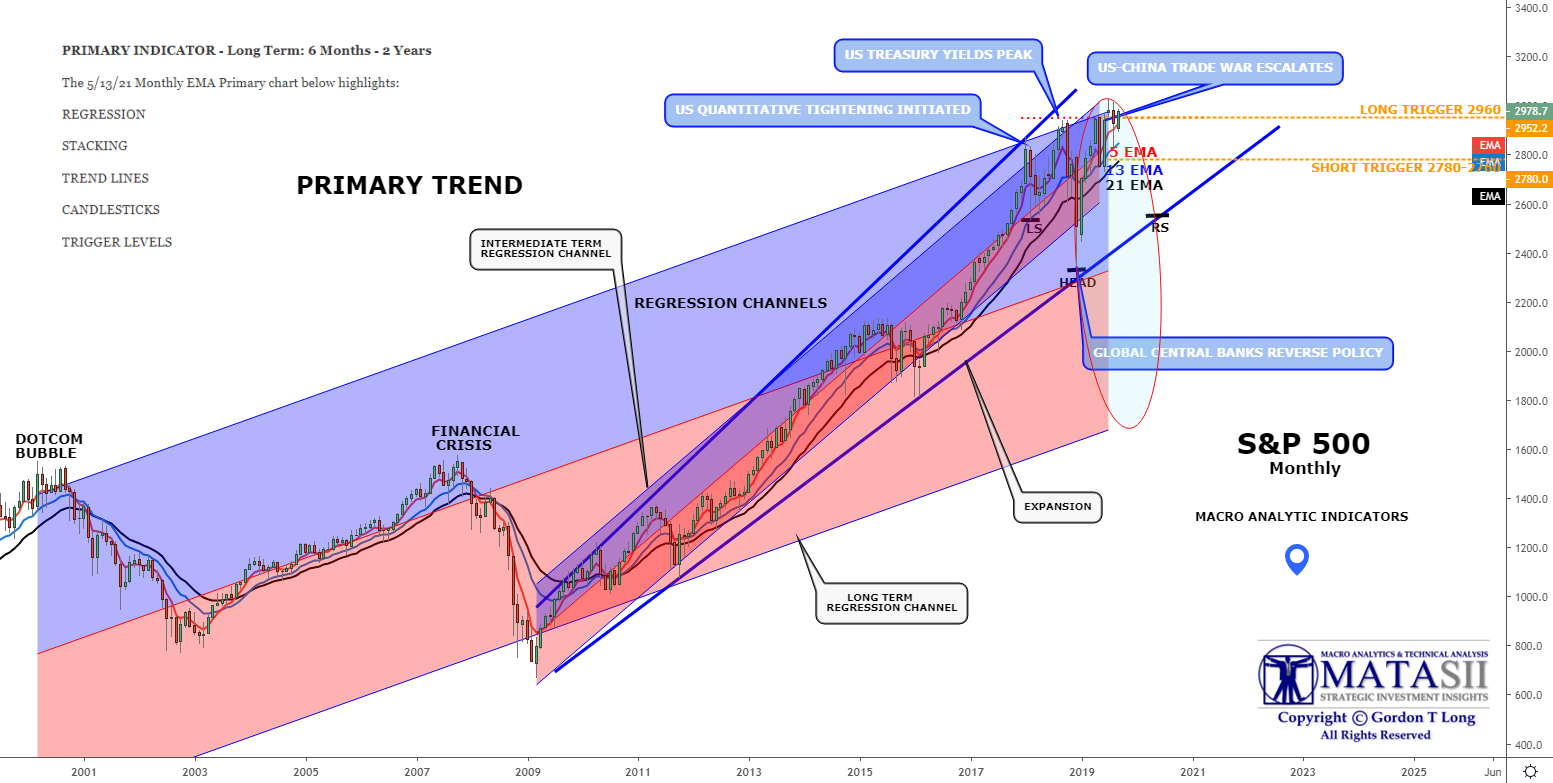
- We have shown on the second Primary chart an Ellipse which suggests a correction between now and year beginning 2020 lies ahead.
- Prices are presently at the Regression Channel which started with the Financial Crisis lows. It will act as near term overhead resistance.
- A break of the Monthly 12 MMA (first chart) and the 5 EMA (second chart) need to be monitored closely.
- A break of these is usually an indication of at least multi-week market weakness (or worse).
WHAT TO WATCH FOR:
- Pay particular attention to a downward "curl" in the 12 and 24 MMA's upper Bollinger Bands. They still have an upward sloping trend.
We will update the Secondary and Tertiary Macro Analytic Indicators for further granularity and clearer indications of what to watch for in the Shorter to more Immediate term.
Disclaimer: Information herein was obtained from sources which Mr. Long believes reliable, but he does not guarantee its accuracy. None of the information, advertisements, website links, or any ...
more
How did you like this article? Let us know so we can better customize your reading experience.

Comments
Leave a comment to automatically be entered into
our contest to win a free Echo Show.

