
S&P 500 Sector Valuations
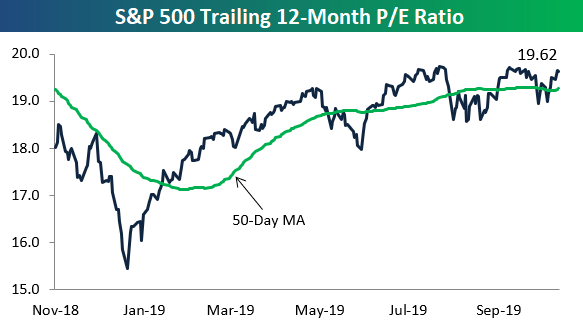
The S&P 500’s trailing 12-month P/E ratio has ticked up to 19.62 recently, which is close to its highest level of the past year. For valuations to stop expanding on any breakout higher for the S&P, we’ll need to see earnings (the “E” in P/E) keep up with price. That’s going to be a tough ask for corporate America this quarter, so we may be heading into 2020 with valuations at more concerning levels.
(Click on image to enlarge)
Below are one-year charts of P/E ratios for ten S&P 500 sectors. Consumer Discretionary has the highest P/E ratio at 24.15 followed by Technology at 23.38. Tech’s P/E has really jumped a lot recently to new 52-week highs. The Financial sector has the lowest P/E of the major sectors at just 13.27.
(Click on image to enlarge)

(Click on image to enlarge)

Start a two-week free trial to Bespoke Premium to sample our actionable research. If you use more


