
S&P 500 Roars Higher On Omicron Optimism As Traders Reassess Pandemic Risks
U.S. stocks rose for a second straight day on Tuesday, continuing their rebound from the late November sell-off as traders became less fearful of the COVID-19 omicron variant. At the market close, the S&P 500 climbed 2.07% to end the session at 4,687, coming increasingly close to its record high of 4,744. The Dow Jones also powered higher, leaping 1.4% (492 points) to 35,719, while the Russell 2000 managed to rally 2.28% to 2,253, a move that allowed the small and mid-cap index to retrace more than a third of its recent correction.
A preliminary report from South African hospitals released the past weekend, suggesting that omicron is causing only mild illness, has led Wall Street to bet that the new strain of the virus will not derail the global recovery or have a major negative impact on mobility and, therefore, activity.
Comments by Anthony Fauci, the Chief Medical Advisor to the White House, that omicron is "almost certainly" less serious than delta, and a study by the Africa Health Research Institute indicating that Pfizer's vaccine offers some protection against the variant in question, also bolstered bullish sentiment, accelerating buying interest amid the FOMO mentality.
Even though risk appetite has bounced back this week, traders should remain vigilant, as health authorities do not yet have sufficient information to judge how big a threat the new coronavirus variant will be. While early details seem encouraging, the hypothesis could change as more data become available. Either way, we’ll know more in the coming days and weeks after scientists complete their research and share their findings.
U.S. STOCKS OUTLOOK
If future studies confirms that existing vaccines remain effective and that omicron only leads to mild disease while conferring immunity against other more deadly COVID versions after it has been contracted, there is room for the equity market to rally further heading into 2022, with reopening stocks having the greatest upside potential.
The opposite is also true. If omicron can defeat vaccines and turns out to be more dangerous than initially feared, sentiment is likely to take a hit, paving the way for a large sell-off. As we approach the end of the year and the holiday period, it is important to keep in mind another point: trading volume is likely to drop as traders close their books. At times, thinner liquidity can spark explosive volatility, amplifying downside and upside moves in the market, similar to what transpired the day after Thanksgiving.
Turning our attention economic data, the U.S calendar is devoid of market-moving events on Wednesday and Thursday. However, Friday should be interesting as the U.S. Department of Labor will release the November inflation report. Price pressures are expected to accelerate significantly, with headline CPI seen at 6.8% y/y versus 6.2% y/y in October, and the core gauge seen at 4.9% y/y from 4.6% y/y.
If inflation results surprise to the upside or details reveal that the stickier CPI components are growing too aggressively to the point they risk contaminating expectations, treasury yields could spike higher as traders begin to price faster monetary policy normalization (faster QE tapering and sooner liftoff for borrowing costs). This scenario could weigh on the equity market, especially on technology and growth stocks with elevated valuation. Under this assumption, the Nasdaq 100 or the heavily tech skewed S&P 500 may be more vulnerable to pullback than the Dow Jones Industrial Average, for example.
S&P 500 TECHNICAL ANALYSIS
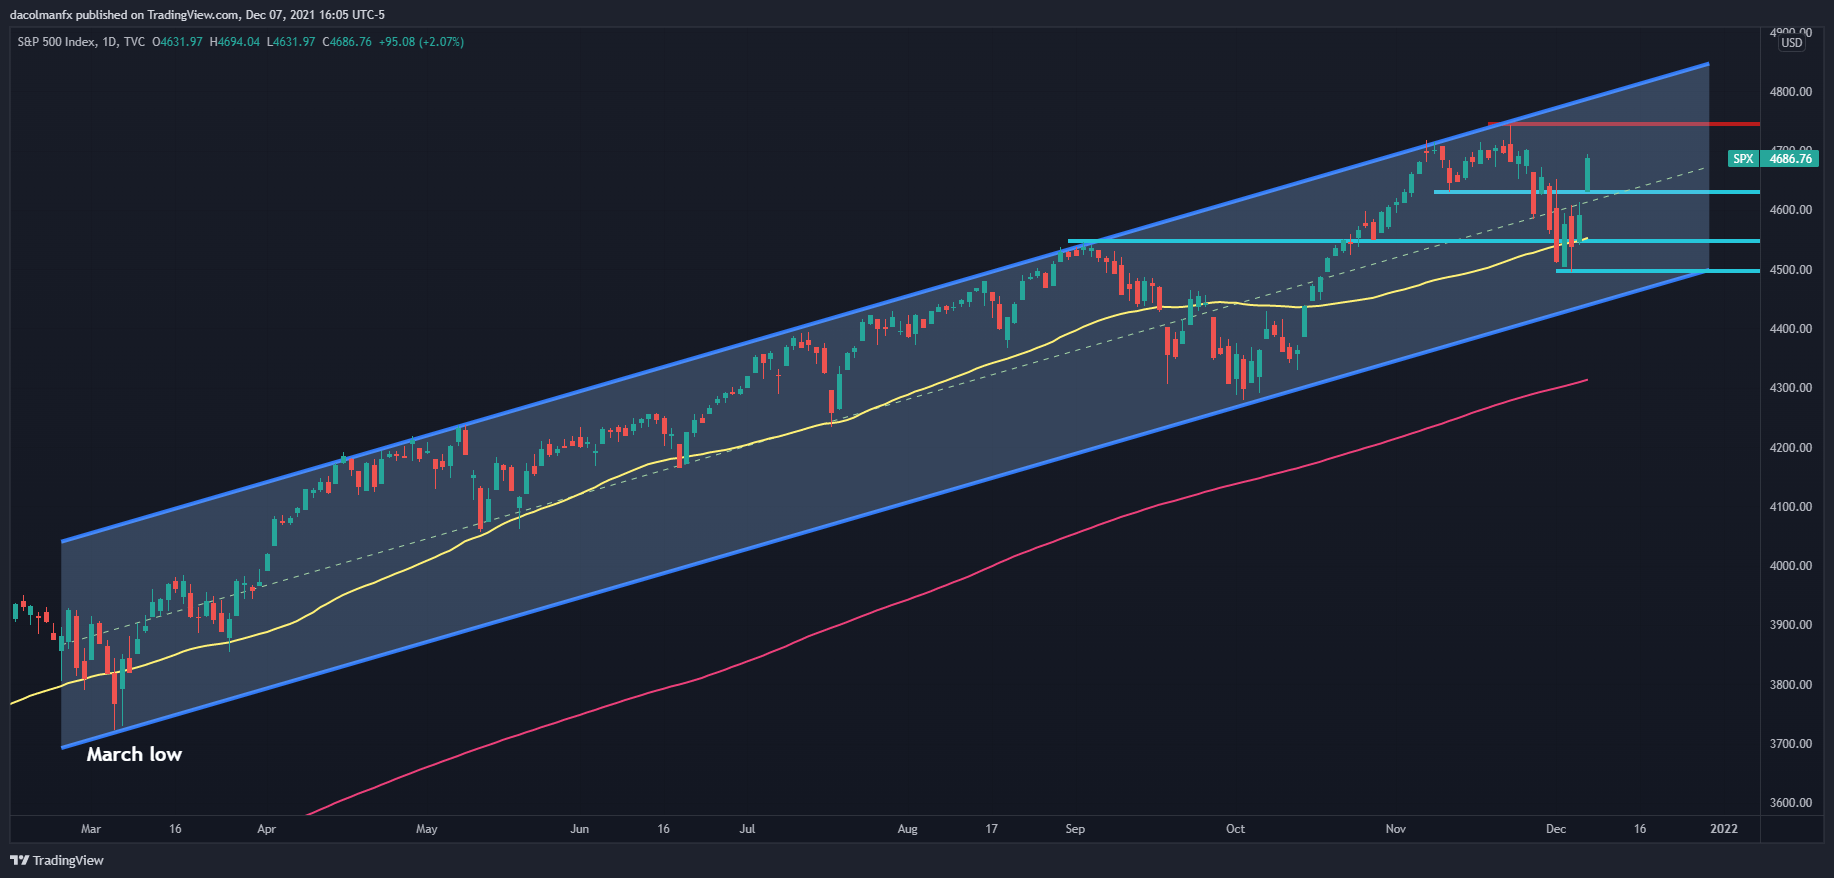
After breaking above the 4,620-resistance area (now support based on the polarity principle), the S&P 500 has staged a strong rally and looks poised to retest the all-time high of 4,744 amid increased risk appetite. If this scenario plays out in the coming days, traders should keep a close eye on the index's reaction around its record, as if the price manages to overtake this barrier and print a higher high on a daily closing basis, buying interest could accelerate, paving the way for a climb towards channel resistance close to the 4,800 psychological region. On the flip side, if sellers resurface and the S&P 500 begins to retreat, technical support appears at 4,620, though a move below this floor can expose the 50-day simple moving average near 4,545.
S&P 500 TECHNICAL CHART
(Click on image to enlarge)
Disclaimer: See the full disclosure for DailyFX here.


