
S&P 500 Price Outlook: VIX Index Sends Bad Omen For Stocks
Stocks look set on closing the month of May on an unencouraging note. S&P 500 Index price action has drifted lower by about 2% from the prior trading session’s intraday high. Despite the latest stretch of weakness, the S&P 500 gained 6% on balance since its April 30 close, which extended the recovery in equities largely fueled by sustained coronavirus optimism.
Unwavering investor risk appetite over recent weeks looks accompanied by a huge volatility squeeze that pressured the popular VIX Index ‘fear-gauge’ materially lower. Following the most recent volatility cycle normalization, however, the VIX and other cross-asset volatility benchmarks allude to a potential bottoming attempt as investor uncertainty lingers. This likely corresponds with China tension rising and mounting risk of another trade war, which presents a major threat to global GDP growth, market sentiment, and stocks.
VIX INDEX PRICE CHART: DAILY TIME FRAME (26 DEC 2019 TO 29 MAY 2020)
(Click on image to enlarge)
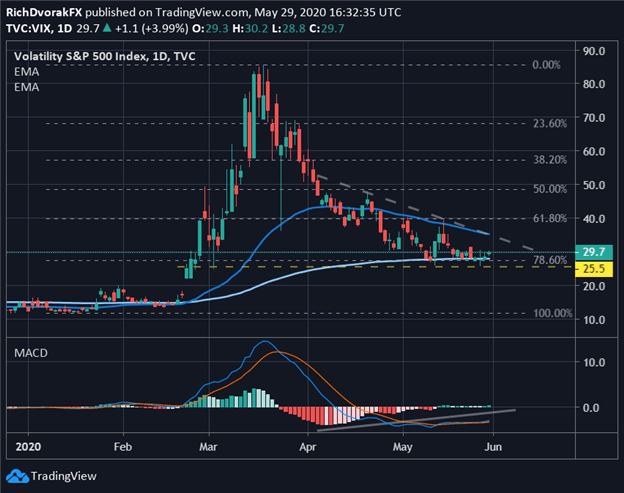
The VIX Index appears to have formed a double bottom pattern around the 25.5 level. This area of technical support is underpinned by a confluence of its 200-day exponential moving average, March 03 swing low, and 78.6% Fibonacci retracement of the year-to-date trading range. Bullish divergence indicated by the MACD also suggests upward momentum is building.
Considering relatively sticky volatility and still-elevated investor uncertainty, in addition to the fundamental driver of escalating US-China tension, it seems that S&P 500 Index price outlook could quickly sour. Nevertheless, as unfazed trader sentiment broadly crushes volatility, the VIX Index might struggle to overcome its series of higher lows recorded since April.
VIX INDEX, FX VOLATILITY, GOLD VOLATILITY, EMERGING MARKETS EQUITY VOLATILITY IN FOCUS
(Click on image to enlarge)
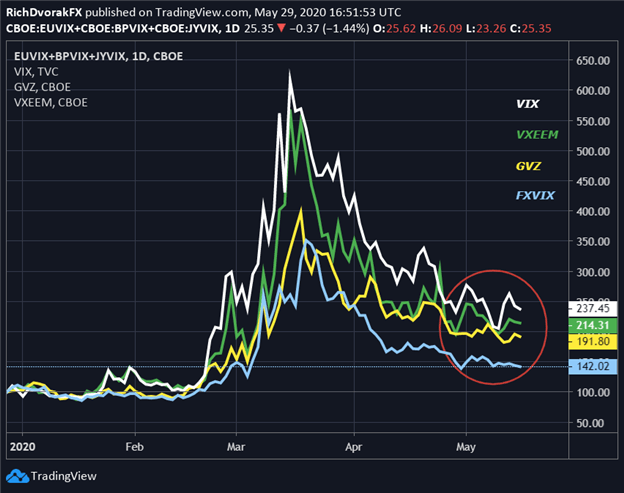
That said, key cross-asset volatility benchmarks are relatively unchanged this month as S&P 500 volatility (VIX), gold volatility (GVZ), currency volatility (FXVIX), and emerging markets equity volatility (VXEEM) gyrate sideways. Keeping close tabs on cross-asset volatility might provide traders with a possible bellwether to market sentiment and perceived uncertainty, which could foretell where the S&P 500 Index heads next.


