
S&P 500 Price Outlook: Can Stocks Continue To Rally?
The S&P 500 shot to new records Monday as it looked to extend the bullish price action enjoyed in the first week of February. With fiscal support in the works and earnings from the largest technology companies completed for the quarter, the fundamental foundation of US equities remains sturdy headed into the second half of the month. Single-stock volatility may persist as earnings from other corporations trickle in, but the broader market trend remains higher at this time.
Source: IG
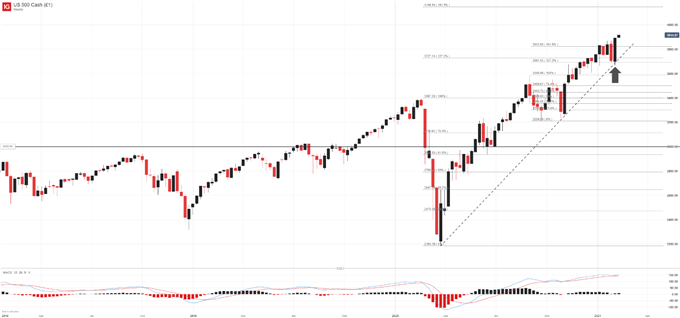
To that end, the S&P 500 just posted an encouraging candlestick formation that might suggest further gains are in store after the index rallied last week. Visible on the weekly timeframe, a bullish engulfing candle – often viewed as a pattern indicating an imminent reversal at the bottom of a downtrend – might hint more gains are on the horizon.
S&P 500 PRICE CHART: WEEKLY TIME FRAME (JANUARY 2018 – FEBRUARY 2021)
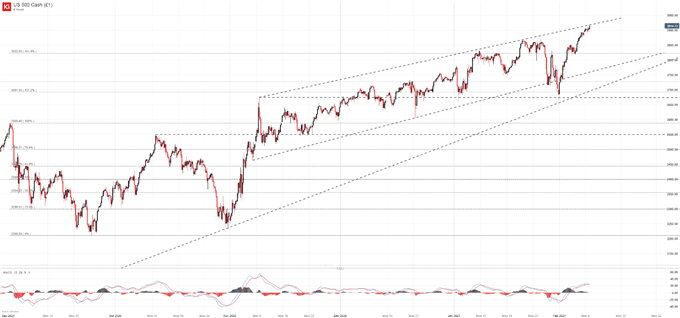
In the shorter term, a nearby trendline narrowly overhead might offer some semblance of resistance. That said, the S&P 500 enjoys a bounty of support beneath that will look to ward off a deeper pullback.
S&P 500 PRICE CHART: 4 – HOUR TIME FRAME (SEPTEMBER 2020 – FEBRUARY 2021)
Further still, IG client sentiment data reveals retail traders remain net-short the index. Since we typically take a contrarian view to crowd sentiment, positioning suggests the S&P 500 may continue to rise.
Disclosure: See the full disclosure for DailyFX here.


