

Has this bear market rally started to run out of steam?
Last week saw dojis print near resistance for the Dow, S&P and Nasdaq. And given the context of prior price action, where strong rallies had driven stocks to fresh near-term highs, that indecision has a tendency to take on a bearish appeal; either from the perspective of bearish swings or even just short-term pullbacks in bullish trends.
In the S&P 500, we can see last week’s doji printing right at the 4k psychological level, which is confluent with the 61.8% Fibonacci retracement of the August-October sell-off. The 50% marker of that same study remains relevant, as well, as this helped to hold last week’s low for the index.
S&P 500 Weekly Chart
(Click on image to enlarge)
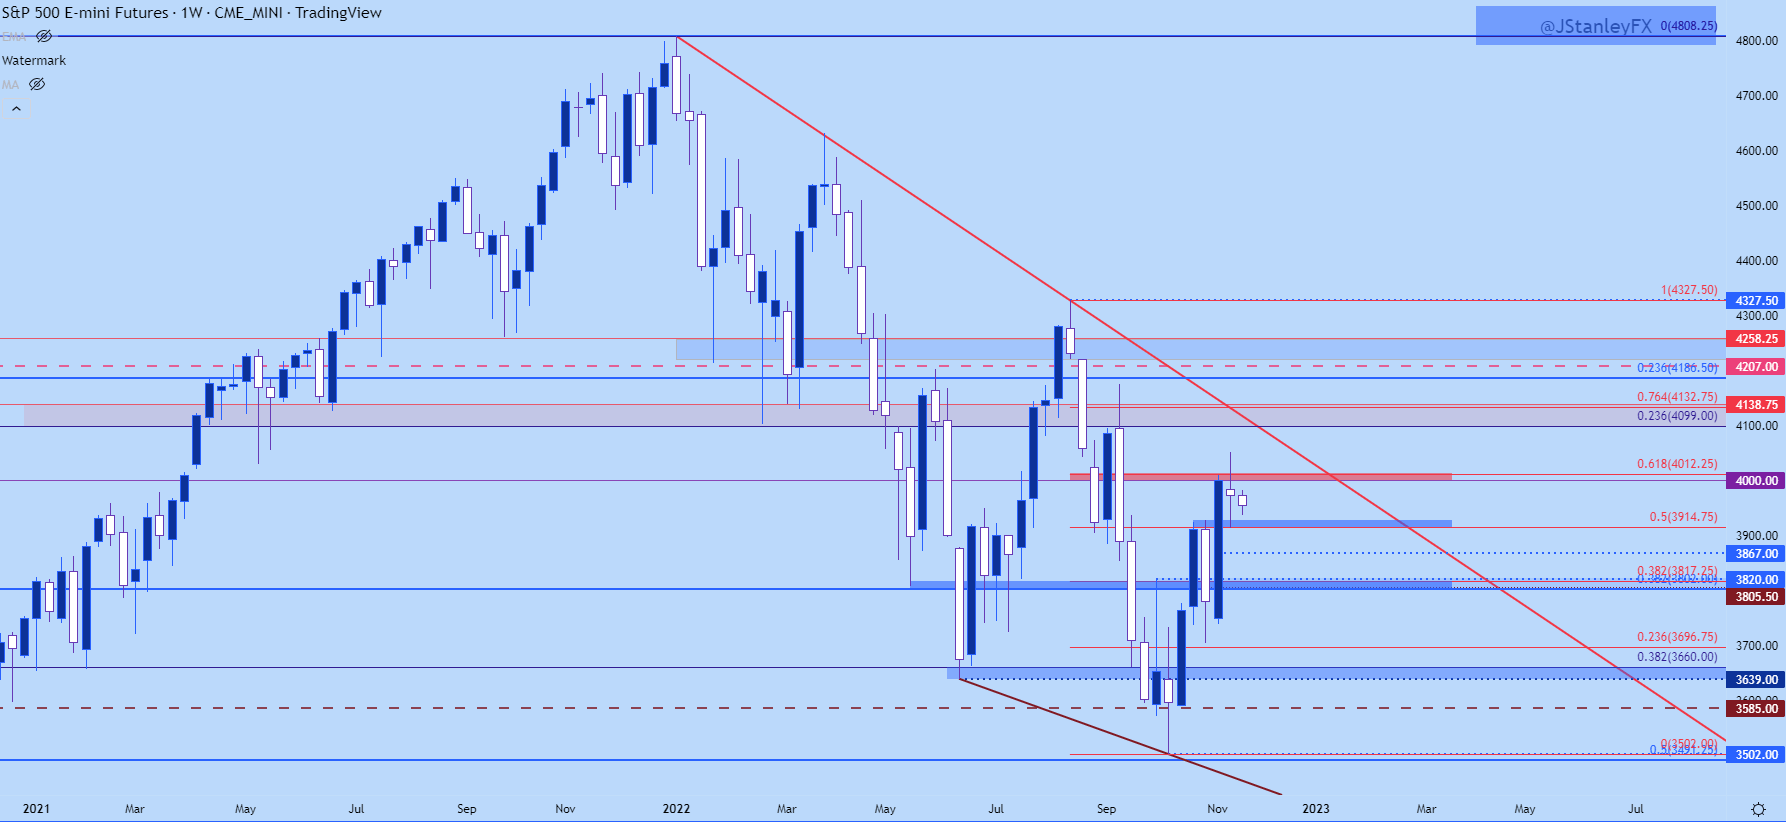
Chart prepared by James Stanley; S&P 500 on Tradingview
From the daily chart we can get a better view of that recent grind. Prices in the S&P tried to breakout last week on Tuesday, eventually setting a fresh high at 4050 before fears around a missile landing in Poland created a quick swell of risk aversion.
Markets soon stepped back from the ledge when they realized that World War III hadn’t started; but prices in the S&P continued to pull back on Wednesday and Thursday anyways, eventually finding support at that 50% marker that plots at 3915.
This highlights the spot that bulls need to defend and if they don’t, or if they fail, the next spot of support is at the prior swing high of 3867. After that, we have another confluent zone that runs from 3802-3820 and if bears can push below that area, there’ll be a near-term trend to work with focus then shifting back for a run down towards 3660.
S&P 500 Daily Chart
(Click on image to enlarge)
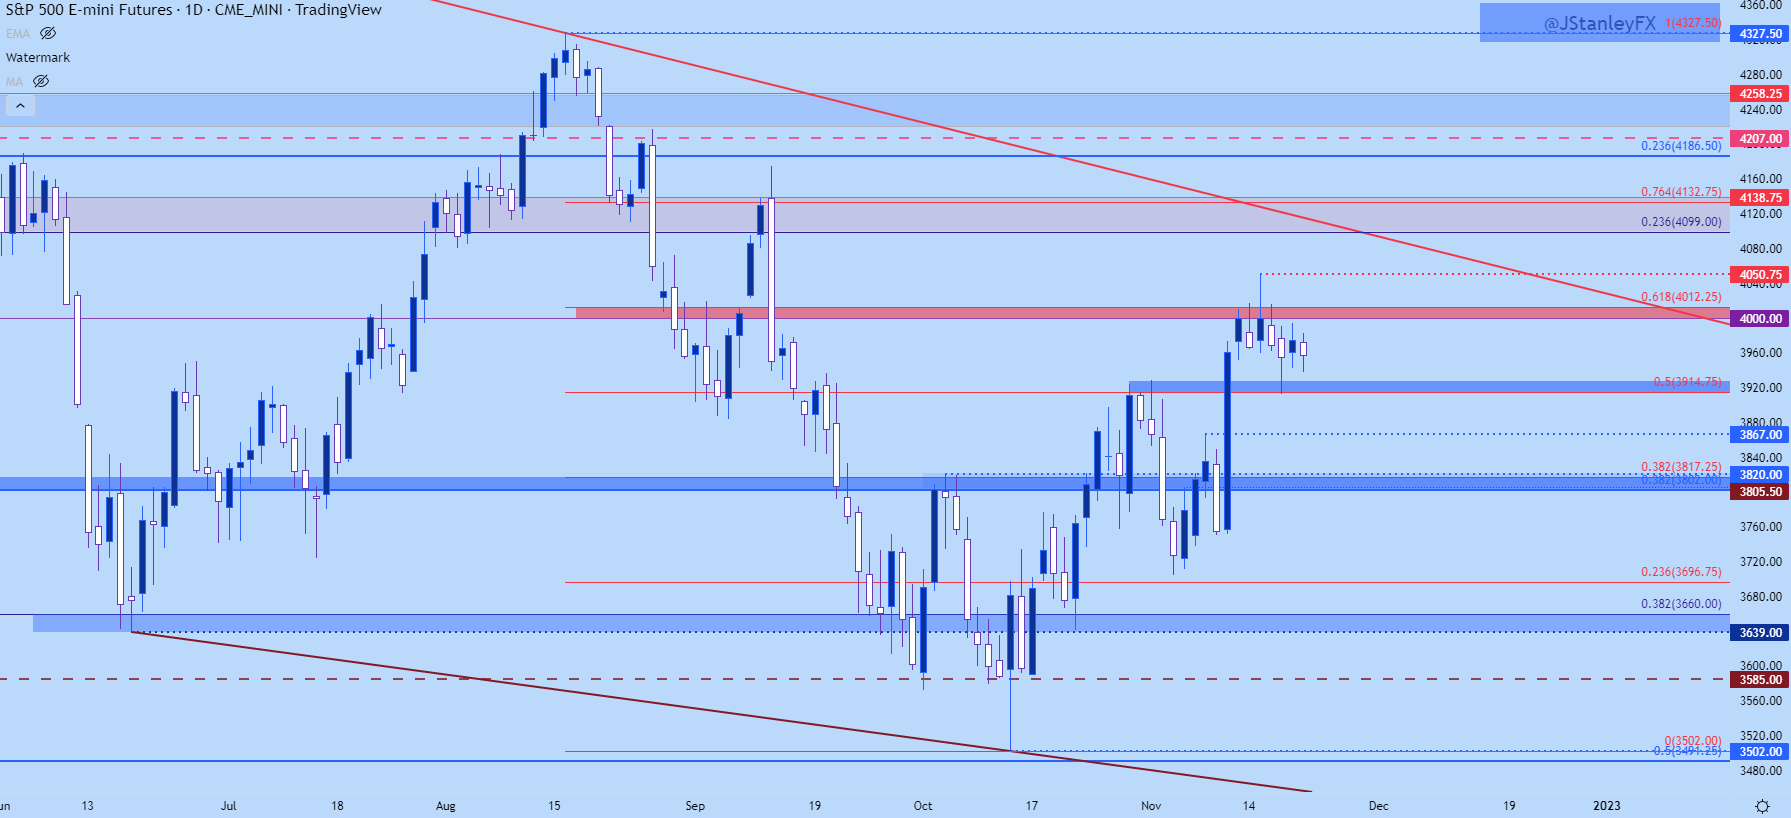
Chart prepared by James Stanley; S&P 500 on Tradingview
DOW JONES
The grind is quite visible on the daily chart of the Dow Jones and from a price action perspective, this can be called a ‘stick sandwich’ given the candlestick wicks sticking out on either side over the past week and change.
This can also be helpful from a strategy perspective as price action has built into a box or rectangle which is, in essence, a range. Resistance has continued to hold around the 34k level while support has so far held above the 33,189 level that set the low last week.
The complication with working box breakouts here is the resistance or support that shows up just outside of the box, and for longer-term traders, they may want to see some reconciliation there first before plotting directional approaches.
On the topside of Dow price action, a key zone of resistance plots around 32,450, which currently helps to mark the six month high for the index. And below last week’s low is a confluent spot of resistance-turned-support that runs down to the 33,000 psychological level.
Dow Jones Daily Price Chart
(Click on image to enlarge)
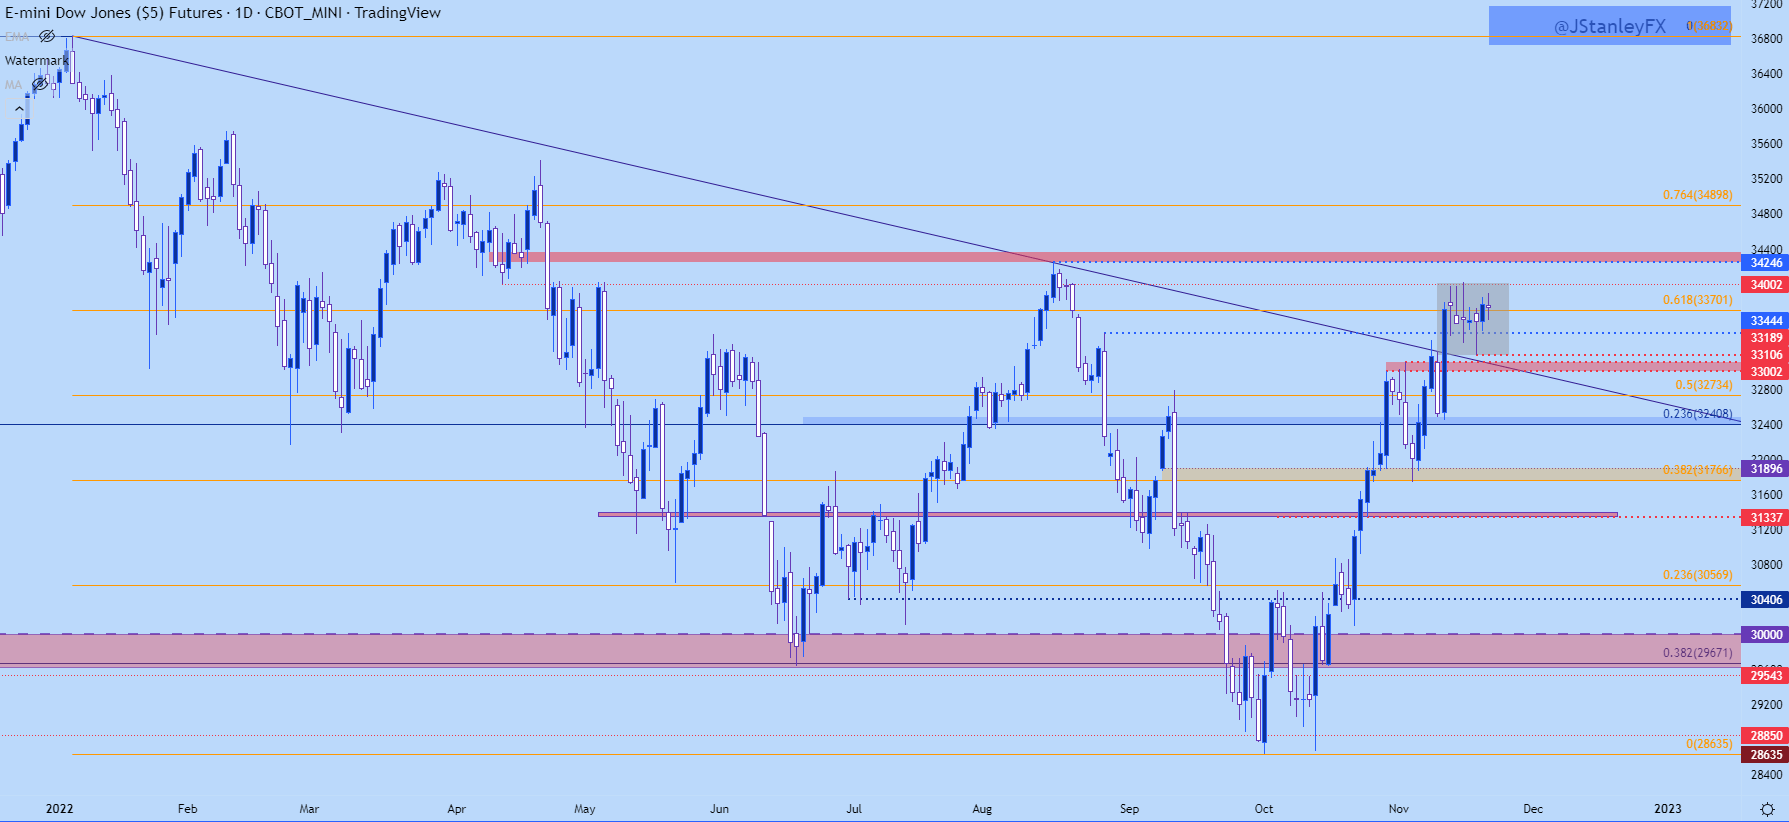
Chart prepared by James Stanley; Dow Jones on Tradingview
NASDAQ
While the Nasdaq has had similar range-bound tendencies of late, there’s also some possible context for a directional lean as produced by horizontal support around 11,569 and a series of lower-highs that’s posted since that Tuesday swing.
This makes for a descending triangle formation and is often approached with the aim of bearish breakouts and, in this case, that points towards another support level in the Nasdaq around the Fibonacci level at 11,294.
Nasdaq Daily Price Chart
(Click on image to enlarge)
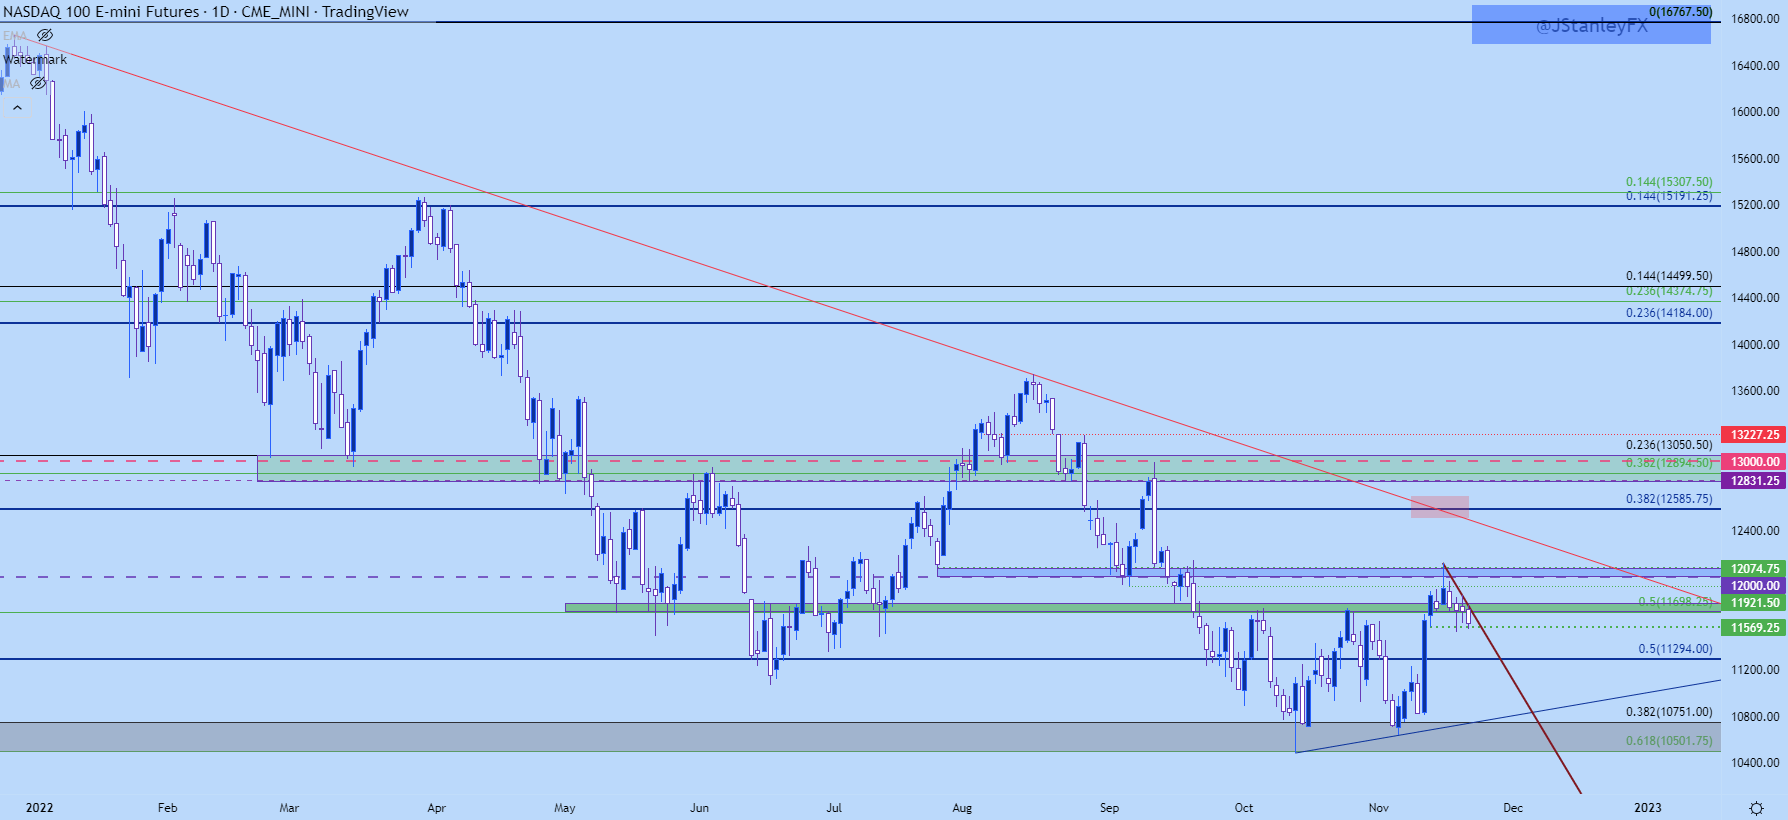
Chart prepared by James Stanley; Nasdaq 100 on Tradingview
NASDAQ SHORTER-TERM
Taking a closer look at the setup, the next support below the current level holding the lows in the formation plots around 11,453, after which that longer-term Fibonacci level comes into the picture around 11,294, and below that, another prior price action swing sits at 11,091.
Nasdaq Four-Hour Chart
(Click on image to enlarge)
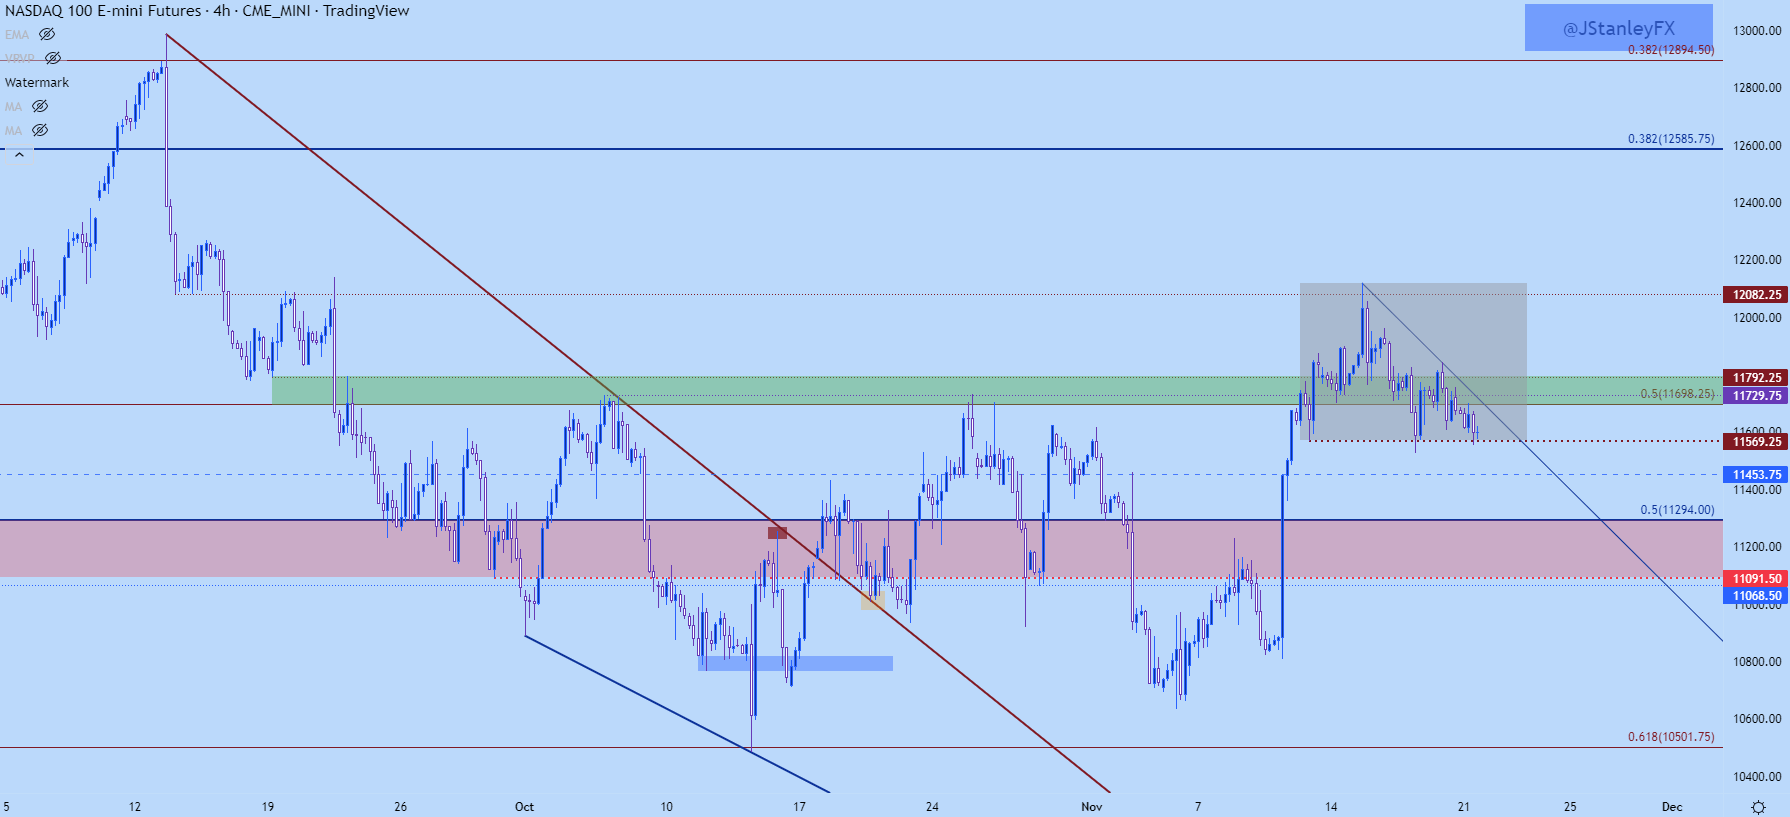
Chart prepared by James Stanley; Nasdaq 100 on Tradingview
More By This Author:
EUR/USD Update: German PPI Surprise Fails To Arrest Slide As Risk-Off Mood Returns
US Dollar Finds Firmer Footing As Treasury Yields Lift And China Locks Down
Dow Jones, Nasdaq 100, S&P 500 Forecast: Thanksgiving Means Illiquidity, But Volatility?


Comments
Log in or sign up to join the conversation.