
S&P 500 Earnings Update And Economic Data Review

The earnings per share (EPS) for all S&P 500 companies combined increased this week from $171.33 to 173.12. The forward EPS has now grown 8.87% since January 1st.
Companies continue to crush earnings expectations. 57% of the S&P 500 has now reported Q4 results. 84% of those companies have beat earnings estimates, and earnings have come in a combined 17.7% above those estimates. (I/B/E/S data from Refinitiv)

The S&P 500 index made a new high this week, gaining 4.65%.

The S&P 500 index increased more than the EPS growth for the week, pushing the price to earnings ratio up to 22.5, from 21.7.

The earnings yield now stands at 4.45%, while the 10 year treasury bond rate ticked up to 1.17%.

The equity risk premium (earnings yield minus treasury rate) now stands at 3.284%.
Economic data review

January’s ISM Manufacturing PMI came in at 58.7, missing expectations and down -1.8% from last month’s downwardly revised 60.5. Still it was a pretty solid report overall, with all 5 sub-indexes in growth territory, and the 8th straight month of expansion (any reading above 50 is expansionary). Historically, the manufacturing sector seems to pause around the 60 area.
Per the ISM report, “The manufacturing economy continued its recovery in January. Survey committee members reported that their companies and suppliers continue to operate in reconfigured factories, but absenteeism, short-term shutdowns to sanitize facilities and difficulties in returning and hiring workers are continuing to cause strains that limit manufacturing growth potential. However, panel sentiment remains optimistic (three positive comments for every cautious comment), similar to December levels.”

January’s services PMI came in 58.7, well above expectations and +1.7% above Decembers number (which was revised up from 57.2 to 57.7). January’s number is the highest reading since February 2019 (58.8). The employment index swung into expansion territory, from 48.7 to 55.2., a good sign going forward.

My weighted ISM (which accounts for the size the manufacturing and services sectors have in today’s economy), increased in January, from 58.4 to 58.7. This is the highest monthly reading since November 2018. The overall resilience of the economy continues to surprise to the upside, even though some sectors are clearly being effected more than others.

The employment picture still leaves a lot to be desired. The January jobs report was another dud. Only +49,000 net jobs were created, while December and November numbers were revised lower.

We remain 9.487 million jobs below the pre-COVID peak, recovering only about 56% of the net job losses due to COVID. We all hope for a speedy jobs recovery. The Fed will remain accommodative until the job market recovers.
Notable earnings reports

Amazon crushed earnings expectations. The street was expecting adjusted EPS of $7.20 and they ended up reporting EPS of $14.09 (+118% growth over Q4 2019). Operating income grew 77%, while margins increased from 4.4% to 5.5% due to revenue growth.
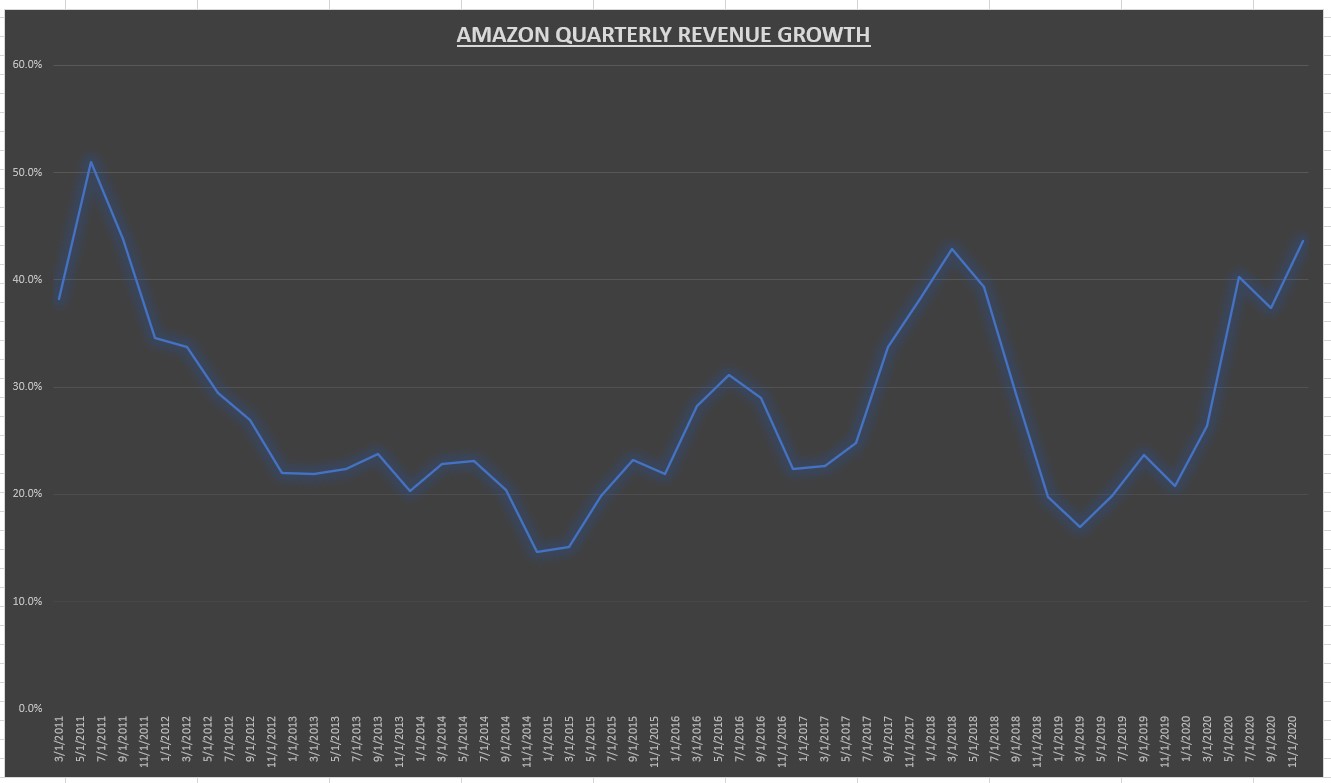
Amazon reported Q4 revenues of $125.5 billion, making it now the second company to report quarterly revenue above $100 billion. Revenues grew 44% for the quarter, which is the highest growth rate since Q2 2011.

Net revenue for all of 2020 came in at $386 billion, a growth rate of 37.6%, the highest annual growth rate since 2011.

The revenue growth helped offset the spending on COVID related costs. Annual operating margins improved to a record 5.93%. Margin expansion shows the potential earnings power, which will likely only get better once COVID spending declines. The company also beat expectations on forward guidance, projecting Q1 2021 revenue growth between 33-40%.
The one potential disappointment was in the Amazon Web Services numbers. AWS Revenue growth slowed to 28%, from 34% growth in Q4 2019, and declined as a percentage of sales (from 12% in Q4 2019 to 10% in Q4 2020). I suspect investors were looking for more, after Microsoft reported Azure revenue growth accelerated in Q4 2020 to 50%.

Google also beat earnings expectations handily. They beat on earnings (+45% growth) and revenues (+24%), showing a comeback in digital ad spending, which should only get better once the travel and leisure sector begins to recover, hopefully in the 2nd half.
This was the first quarter the company broke down its numbers into segments, particularly the cloud. Google Cloud revenue grew 47% over Q4 2019, at $3.8 billion. Cloud as a percentage of total revenues increased from 5.67% in Q4 2019 to 6.73% in Q4 2020.
The company is spending a lot to scale up the cloud business and compete against Microsoft and Amazon. Operating losses as a percentage of the cloud divisions revenue improved from -46% to -32%. Operating margins for the entire company improved year over year, from 20% to 28%.
For the full year 2020, Google’s revenue grew 12.7%. Google cloud revenues grew 46%, and went from 5.51% of total revenue in 2019, to 7.15% of total revenue in 2020. Operating margins improved in 2020, from 21% to 23%. Operating losses for the cloud segment have improved from -74% in 2018, to -43% in 2020.
Strong growth was reported across all advertising channels. +17% growth for Google search, +46% growth for YouTube, and +23% growth for Google Network Members’ properties.

The stock broke out to a new all time high after earnings. Nothing goes in a straight line, corrections can and will happen. But despite the stellar performance, Google and Amazon are still arguably undervalued based upon future growth potential IMO. Would add to either on any sizeable pullback.

Paypal also beat expectations, reporting Q4 adjusted EPS growth of +26%, on revenue growth of +23%. Total payment value for 2020 grew to a record $936 billion, growing 31%. A record year overall and the company guided for high 20’s total payment value for 2021, and revenue growth of around 19%. Net new active accounts grew 72% over Q4 2019 (+95% growth for the full year 2020).
It was s banner year for the company as COVID sped up the transition to mobile/digital payments and ecommerce. Google and Amazon still look reasonably priced to me, but Paypal is one whose valuation looks a bit stretched. A record year sets up for tough comparisons going forward. It will be interesting to see how consumers shift their spending habits once things return to normal. Regardless, the stock has momentum and who knows how far that momentum will push prices up. No intentions to sell, but wouldn’t add unless/until we it pulls back a good 20% or so.
Chart of the week
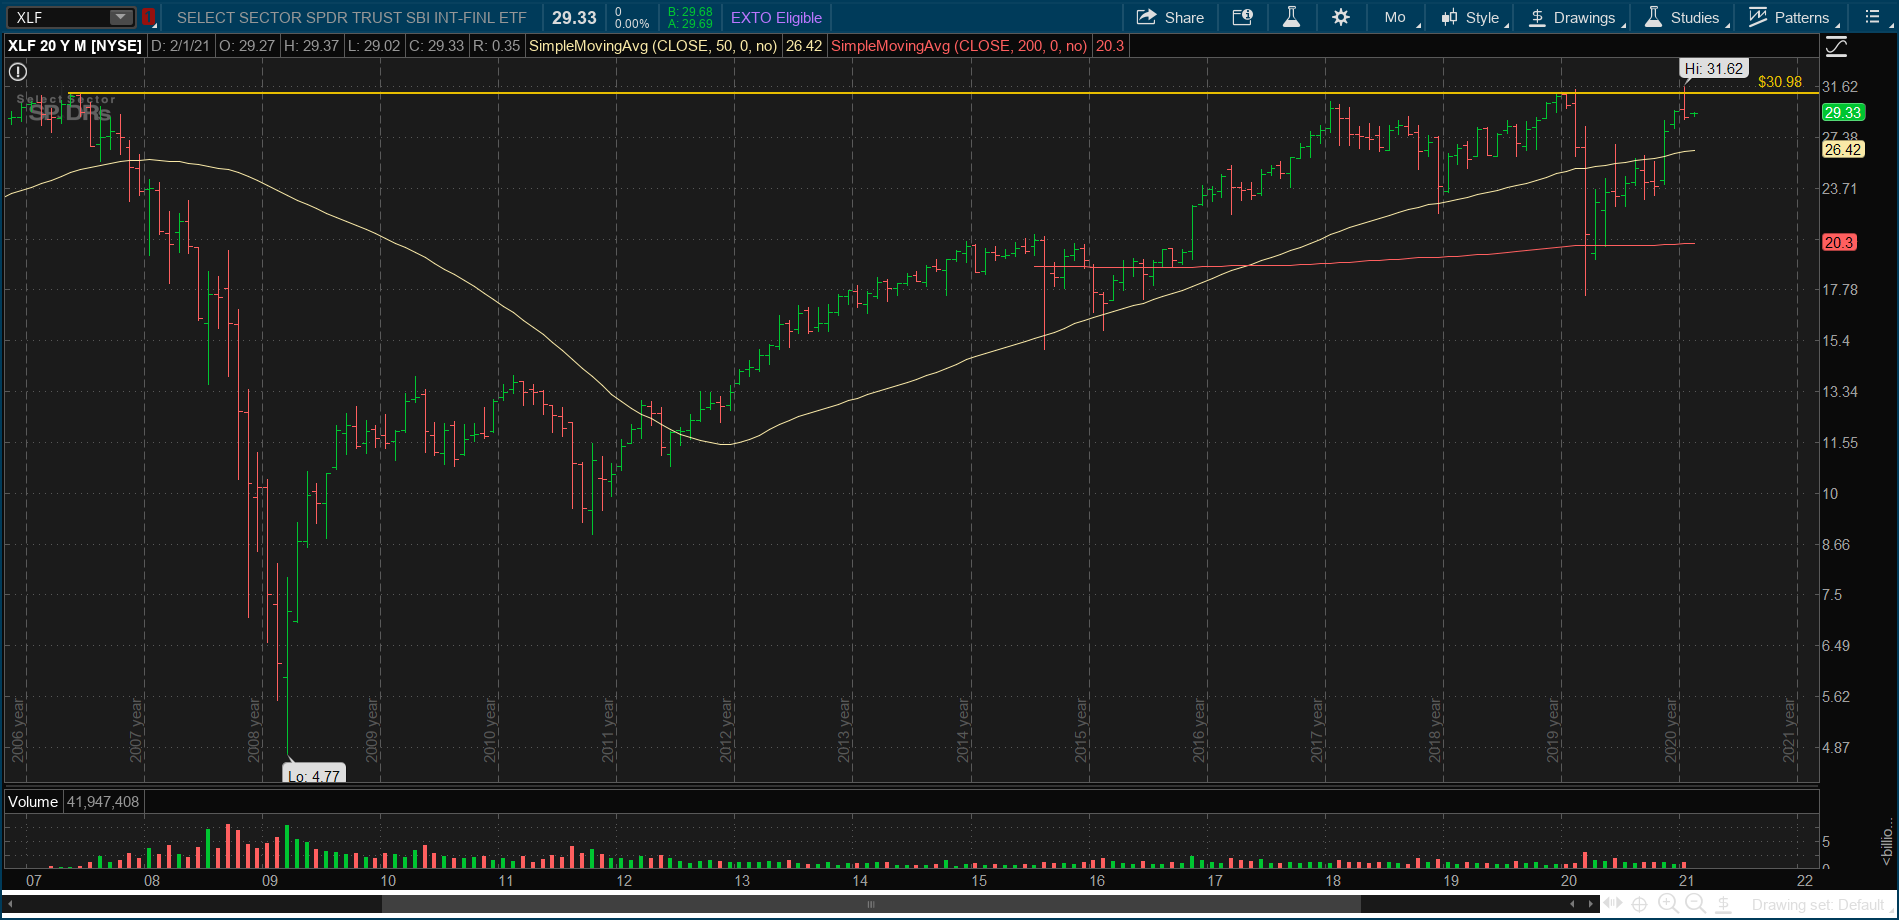
The financial sector (XLF) as a whole is still trading below its 2007 highs. Other than energy, its the only sector that hasn’t broken out. Energy currently makes up only 2.4% of the S&P 500, while financials are about 10.3%. XLF has failed 3 times to breakout now. Will 2021 be the year?
I’ve no special insight into this. On one hand, the steepening yield curve certainly helps financials, but could be offset by increasing regulations. I own some JP Morgan, Berkshire Hathaway, and a little Goldman Sachs and Morgan Stanley. Nothing really excites me about this sector, its more for diversification purposes.
That being said, I really think the sector needs an overhaul to include stocks like Visa, Mastercard, Square, and Paypal. I own all four and that would really give the sector a boost. It’s all about fintech and innovation lately. It will be interesting to see how it plays out. A real breakout in the financial sector would be a boost for value stocks and the entire index.
Summary
An earnings yield of 4.45% (while treasuries remain around 1%) and a beat rate consistently above 80%, sets the bar real low for the economy. The majority of economic data supports the recovery, while the jobs picture is a somber reminder there is much work to be done. The Fed will remain accommodative until jobs recover, which could lead to some inflation concerns in the 2nd half of the year.
The Fed seems to be downplaying the inflation risk to their current policy approach. We are starting to see signs of price pressures in recent economic data. This reminds me of 2018, when the Fed downplayed the risk of the yield curve inversion as they continued to raise short term interest rates. The end result was a sharp 20% drop in the stock market in Q4 2018 (dubbed the “Christmas crash”), until the Fed finally relented and reversed course.
We aren’t there yet (inflation still isn’t above 2%), but I think the inflation risk is being understated, after a record increase in the money supply last year. Investors are starting to get complacent as the market goes higher, and distressed companies stock prices soar for no reason other than speculation. I caution investors not to get carried away chasing the markets higher. Remain disciplined and stick to your plan.
Next week there are 90 S&P 500 companies reporting earnings. I’ll be watching Uber (which isn’t in the S&P 500) and GM on Wednesday, and Nvidia and Dexcom on Thursday extra carefully. For economic data, we’ve got the Small Business Optimism and CPI reports.
Disclaimer: None.


