
S&P 500 Earnings Update And Economic Data Review -Sunday, Feb. 14

The earnings per share (EPS) for all S&P 500 companies combined increased to $173.65 this week. This marks the seventh straight week the forward EPS has increased.
74% of S&P 500 companies have now reported Q4 results. 82% of those companies have beat earnings expectations, and the combined results have come in 17.3% above expectations. (I/B/E/S data from Refinitiv)

The stock market continues to defy gravity. The S&P 500 increased 1.23% this week, for another record closing high.

The S&P 500 increased more than the EPS this week, so the price to earnings ratio rose to 22.7.

The earnings yield on the S&P 500 is now 4.41%, while the 10 year treasury bond rate rose to 1.20% (the highest close since March 18th). The equity risk premium (earnings yield minus 10 year treasury rate) is now 3.213%, which remains generally supportive for risk assets and above average PE valuations.
Economic data review

The Consumer Price Index (CPI) increased +0.3% in January, and is up +1.4% from this time last year. Gasoline and fuel costs were the main driver of the monthly increase.

The Core CPI (excludes volatile food and energy prices) was unchanged in January, and is also up +1.4% from this time last year. Core CPI was up 1.6% year over year last month, so the inflation trend moved lower.

Small business optimism continues to disappoint. The January reading came in at 95, down 0.9 below last month. Current job openings increased 1 percentage point and expected credit conditions increased 2 percentage points. Every other category was negative or unchanged. The percentage of small business owners expecting the economy to improve decreased another 6 percentage points, its lowest level in more than 5 years.
Say what you will about policy, but increased taxes and regulations are an impediment to economic growth. I don’t think its a coincidence the small business optimism index soared after the 2016 election results and stayed well above average until COVID hit. We can debate whether these policies actually have a trickle-down effect to workers, but I don’t think there is a debate these policies have a net negative effect on small businesses that employ roughly 50% of the nations workforce. These policies can have an outsized effect on small businesses that may not be able to handle them as well as the companies in the S&P 500. Judging by the sentiment in these reports, I suspect the new range of the small business optimism index will be in the range of 85-95 (the average range of the 2008 recovery to the 2016 election) for the foreseeable future.
Market Internals

The stock market advance continues to be accompanied by a broad level of participation. The NYSE advance – decline line continues to make new highs.

Along with the S&P 500 advance – decline line.

88% of NYSE listed stocks trade above their 200 day moving average.
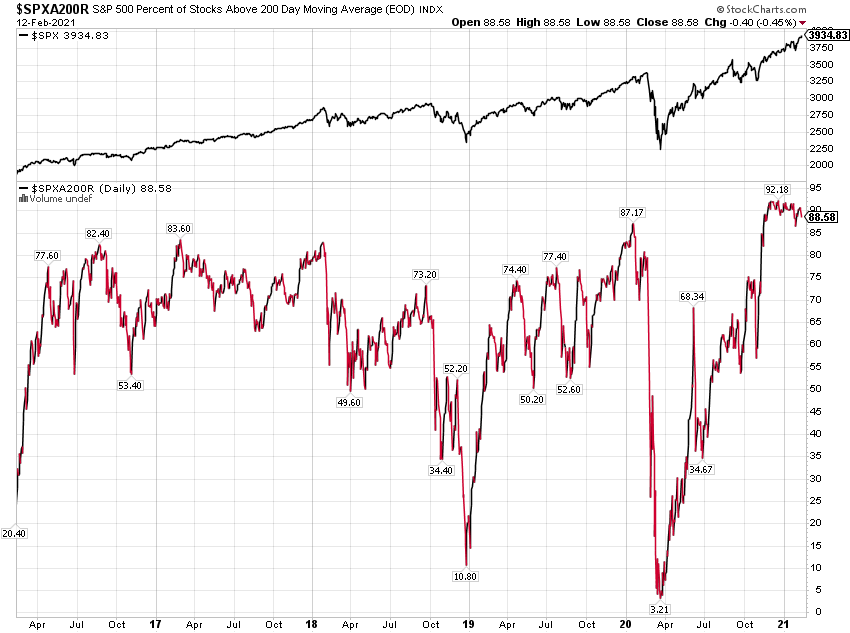
88.5% of S&P 500 companies traded above their 200 day moving averages.
Despite the almost meteoric rebound and recovery, there are no technical signs of exhaustion. This doesn’t mean we can’t get a correction, but typically you’ll see bearish divergences arise in these indicators before a major market top. Nothing yet.
Summary
With inflation below the Fed’s 2% target and almost 10 million net jobs below the pre-COVID highs, the Fed is not even thinking about tightening monetary policy. There is no chance they will raise interest rates, and little chance they will reduce monthly asset purchases (to keep long term rates down) anytime soon.
The solid earnings trend continues, market participation remains strong, and the majority of economic data continues to exceed expectations (Atlanta Fed GDP Now Q1 estimates are currently +4.5%). 2021 is shaping up to be a record for S&P 500 earnings and economic growth.
Still, the M2 money supply has increased by a record amount. It’s hard to envision this won’t create inflationary pressures somewhere down the road. In the past, the Fed’s QE programs increased the monetary base, but since banks didn’t lend those reserves, the hyper inflation predictions never materialized. This is different in my opinion. This has the potential to cause real inflation down the road. But we clearly aren’t there yet.
Why should investors worry about inflation? Simply put, inflation means higher interest rates, higher rates means lower stock valuations (historically), lower valuations mean lower stock prices. Will it be transitory or will it be something more? I’m not sure anyone knows at this point. We are in uncharted territory. It’s easier to lower rates and provide stimulus, than it is to raise rates and tighten policy. Time will tell.
Next week we have 58 S&P 500 companies reporting Q4 results, and for economic data we have retail sales on Wednesday.
Disclaimer: None.


