
S&p 500 Earnings Update & Economic Data Review - Sunday, March 7

The earnings per share (EPS) for all S&P 500 companies combined increased to $174.58 this week, an increase of 0.22%. The forward EPS has increased 9.78% so far this year.
99% of S&P 500 companies have now reported Q4 results. 79% of companies have beaten earnings expectations, and results have come in a combined 15.8% above estimates. (I/B/E/S data from Refinitiv)

Now that Q4 results are largely in we have a good look at full year results for 2020. The current forward EPS is now 7.2% above 2019’s prior all time high.
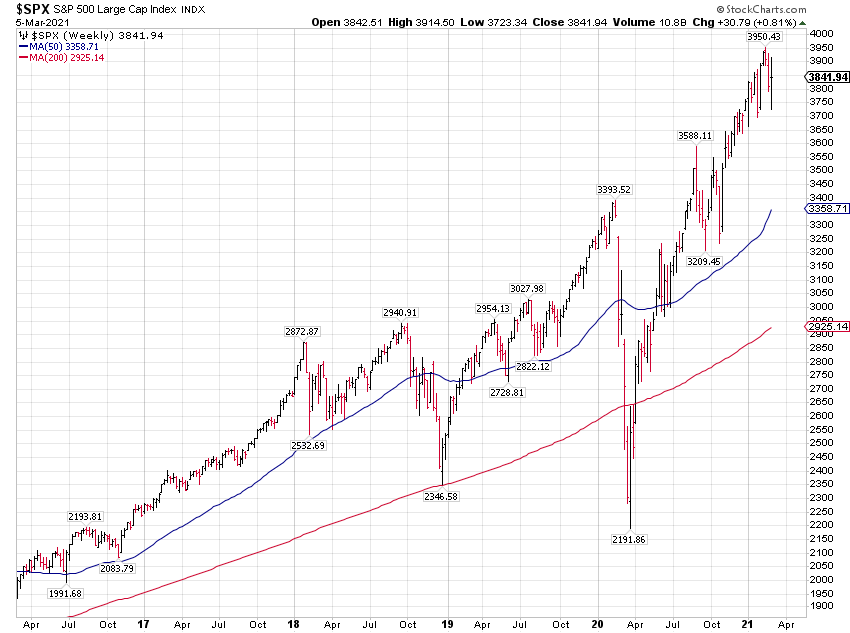
The S&P 500 index finished higher by +0.81% for the week.

The index increased more than the EPS this week so the price to earnings (PE) ratio got a little more expensive at 22 times forward earnings.

The 10 year treasury bond rate increased by about 9 basis points for the week, the highest weekly close since February 2020. The earnings yield for the S&P 500 declined by 3 basis points, currently coming in at 4.54%.
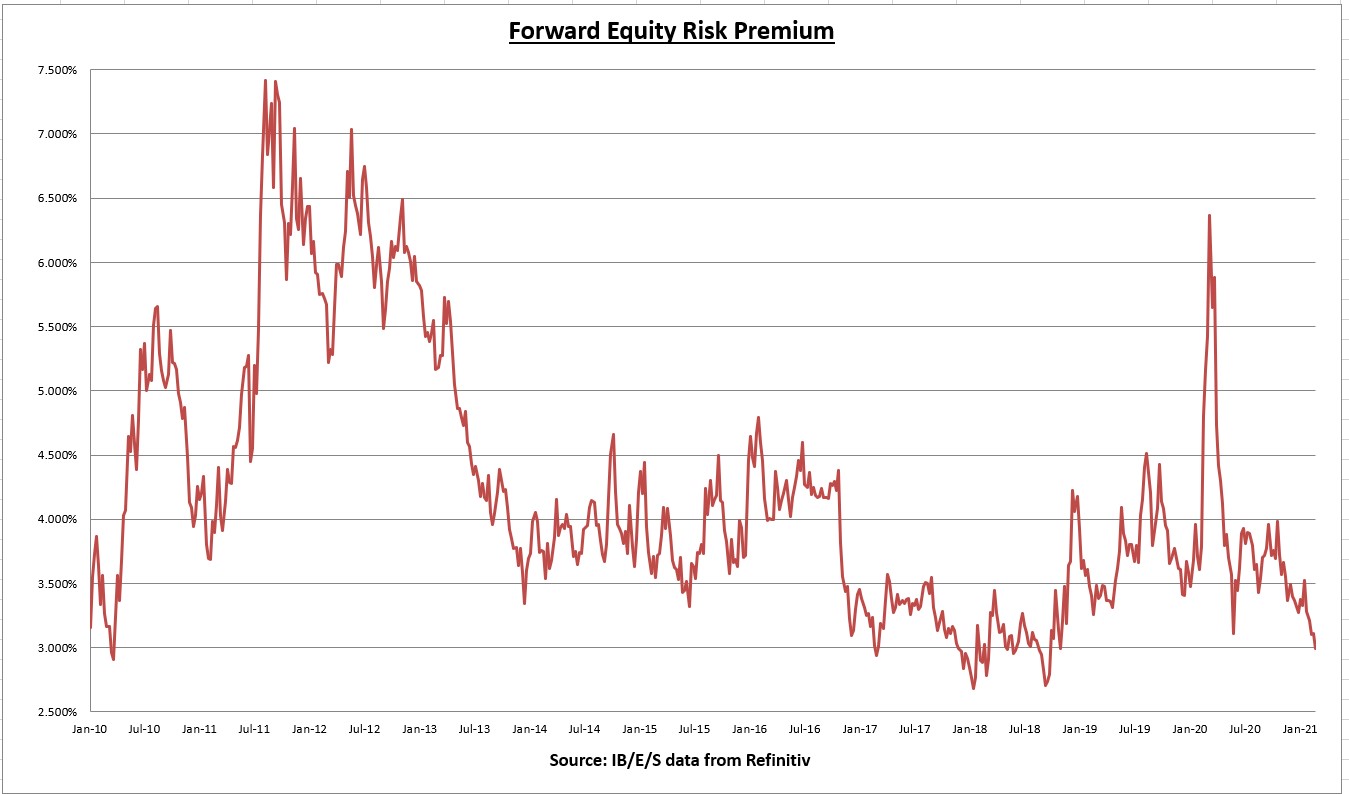
The decline in the earnings yield plus the increase in the risk free rate caused the equity risk premium (earnings yield minus 10 year treasury rate) to decline to 2.99%; the first weekly close below 3% since November 2018.
ERP is a valuation tool, like the PE ratio, where the reading is inverted. Meaning the higher the reading, the more attractive stocks are in relation to fixed income alternatives. And vice versa, the lower it goes, the less attractive stocks are in relation to fixed income alternatives. A 4.50% earnings yield (plus a 1.5% dividend yield) compared to treasuries yielding 1.5% still favors stocks quite convincingly.
Economic data review

The Institute for Supply Management (ISM) Manufacturing PMI for February came in at 60.8, well above expectations and the ninth straight month of growth. The last time ISM Manufacturing came in this high was February 2018, and prior to that you have to go back to May 2004. “For the sixth straight month, survey panelists’ comments indicate that significantly more companies are hiring or attempting to hire than those reducing labor forces.”
The ISM Prices index increased 3.9 percentage points for the month, and is now at the highest level since 2008. “Aluminum, copper, chemicals, all varieties of steel, soy, petroleum-based products including plastics, transportation costs, electrical and electronic components, corrugate, and wood and lumber products all continued to record price increases.” More signs of inflation.
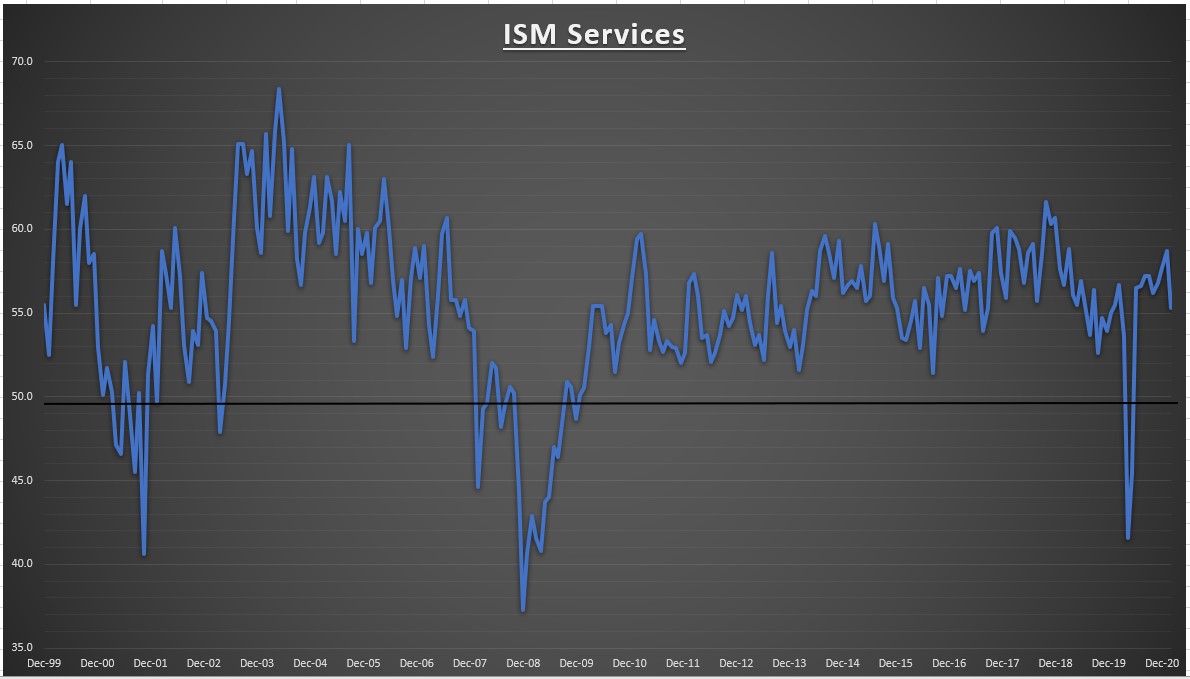
The Institute of Supply Management (ISM) Services PMI for February came in at 55.3, which was below expectations and down from 58.7 in January. Grow moderated, but still well in expansion territory (anything above 50 is expansionary) for the 9th straight month.
“Respondents are mostly optimistic about business recovery and the economy. Production-capacity constraints, material shortages and challenges in logistics and human resources are impacting the supply chain.”

Input costs continue to rise for both the Manufacturing & Services sectors. More signs of inflation and probably a reason for rates rising.

My weighted ISM (based on the percentage that services and manufacturing comprise in todays economy) fell from 58.7 to 56.7. Still well in expansionary territory, and on a weighted basis a reading of 56.7 equates to an annualized real GDP growth rate of 2.9%.
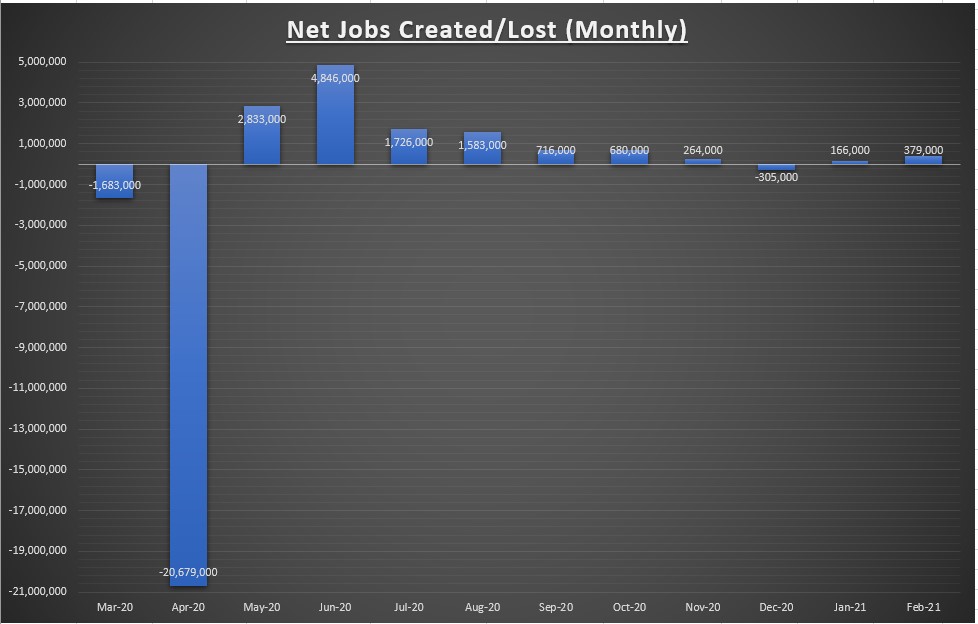
379K net jobs were created in February. December was revised lower from -227K to -306K and January was revised higher from +49K to +166K. A net 38K jobs were gained between December and January revisions. Solid gains in the leisure and hospitality sector helped fuel February results. Positive signs that should hopefully get much better throughout the year.

We’ve now recovered 57.6% of the net jobs lost due to COVID, but still down about 9.474 million jobs since the February 2020 peak. It’s a sobering reminder there is still much work to be done. I’m optimistic this jobs recovery will be swifter than the 2008 jobs recovery which took 49 months.
Notable earnings reports

Zoom (ZM) reported Q4 adjusted EPS of $1.22 (street expectations were $0.79), a 713% y/y growth. And revenue growth of +369% for the quarter, +326% for the full year.
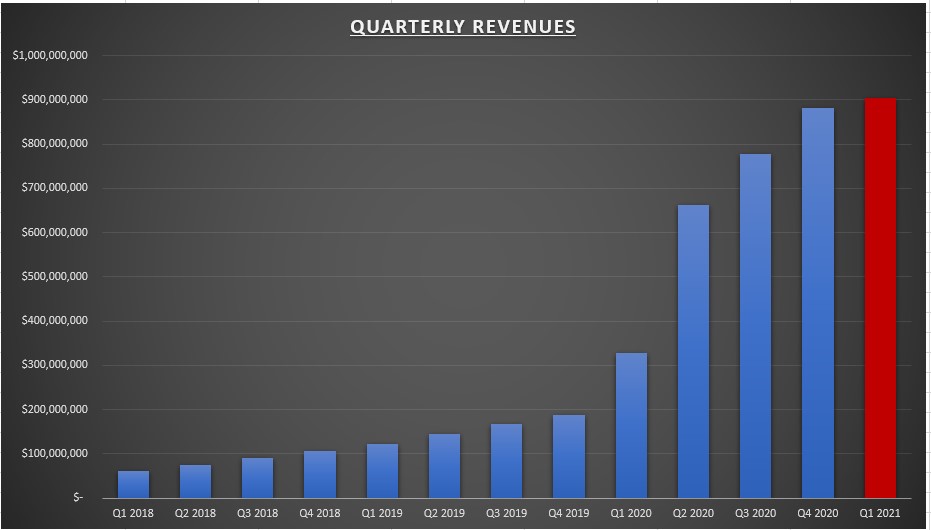
Forecast for Q1 and the next fiscal year also beat expectations. The company expects revenue growth around 176% for Q1 (based on the middle of the forecasted range) and growth of 42% for the entire fiscal year.

Gross margins improved sequentially to 69.7%, while operating margins came in at 29%. A continued improvement both sequentially and year over year.

Operating income exceeded $250 million in Q4. Management has done a great job meeting demand while managing costs. Research & development fell from 11% of total revenue to 5.9% in Q4, while sales & marketing expenses fell from 53.6% of total revenue to 24.3%.
In the 4th quarter, Zoom customers with over 10 employees grew 470% and customers that generate more than $100,000 in trailing twelve month revenues grew 156%. It’s the 11th consecutive quarter that customers with over 10 employees grew more than 130%.
Management has done an exceptional job of overdelivering on growth and margins, and I think margins will continue to improve. But strong quarters like these make for tough comparisons in the future. Larger customers continue to grow, but the percentage of revenues from smaller companies still grew to about 37% (almost double the % of the prior years). I wonder how much of those revenues from smaller customers will be lost when things return to normal? In other words, don’t expect this growth rate to be sustainable.

Zoom has been publicly traded for less than two years now. At $330, the stock has matched the size of the 2019 decline on a percentage basis.

Zoom still trades about 40x sales, so the valuation has never made sense. When you are growing 300%+ and still beating expectations, valuation becomes a secondary thought. But the pace of growth will slow. Management guided for +42% revenue growth this upcoming year, which would be half the growth rate of last year (+88%).
The stock found support at $330 earlier this year. We got a nice bounce of about 33% off that support level, but it’s now retesting that area again. We also have an open price gap at $325, which the high volume gap up after earnings in September. I’m watching these levels closely, but would prefer to add in the mid $200’s. Of course it may never get that low. We never know.
Chart of the week

I spend most of the time on earnings trends for obvious reasons. But the other component of total returns are dividends. The above chart shows the annual dividend distributions for the iShares S&P 500 index ETF (IVV) since inception. Dividends grew 345% (a compounded annual growth rate of 7.74%) over the worst 20-year period since the great depression. It goes to show there is no substitute for a diversified portfolio of high quality companies.
Summary
The market is now undergoing a perfectly normal correction in response to the change in the risk-free rate. I think the market was expecting some “yield curve control” from the Fed (an increase in buying of long term bonds to keep rates low) but Powell basically shot that down (for now) on Thursday. By Friday, all was forgiven.
I’m not convinced the correction is over just yet. If I had to guess, I think this correction will fall within the 8% to 12% range (on the S&P 500) before the uptrend will resume. Who knows. Clearly higher rates will affect each area of the market differently. Investors have a couple options:
- If this correction has you nervous, you’ve probably taken on more risk than you can tolerate. The good news is the 10 year treasury rate is about the same as the S&P 500 dividend yield right now. So from an income standpoint, you can now take some risk off the table while maintaining about the same level of income.
- If you have more cash than you’d prefer (currently yielding next to nothing), you can use this pullback to buy stocks on sale. This may also be a good time to assess your level of diversification too. If your portfolio consists of only large cap growth (tech) stocks, consider using this time to get exposure to value, small cap, international stocks as well. Diversification isn’t fun and exciting, and it basically means you’ll always be holding some assets that are underperforming, but its the best way to weather the inevitable storms and reduce your risk of permanent loss.
Next week we have the NFIB small business optimism report, and Wednesday morning the CPI reading on inflation (which could have a direct effect on bond yields). Q4 earnings are pretty much over but we have three S&P 500 companies reporting. I’ll be paying attention to Mongo DB (MDB) on Tuesday and Docusign (DOCU) on Thursday.
Disclaimer: None.


