
S&P 500 Earnings Update & Economic Data Review - Saturday, April 3

The earnings per share (EPS) for all S&P 500 companies combined increased to $175.54 this week, which is an increase of 0.2% for the week and +10.4% year-to-date.
Sixteen S&P 500 companies have already reported Q1 results (3.2%). So far, 88% of those companies have reported earnings above expectations, and by a combined 7% above those estimates.

The S&P 500 increased 1.14% during this holiday-shortened week, another all-time high.
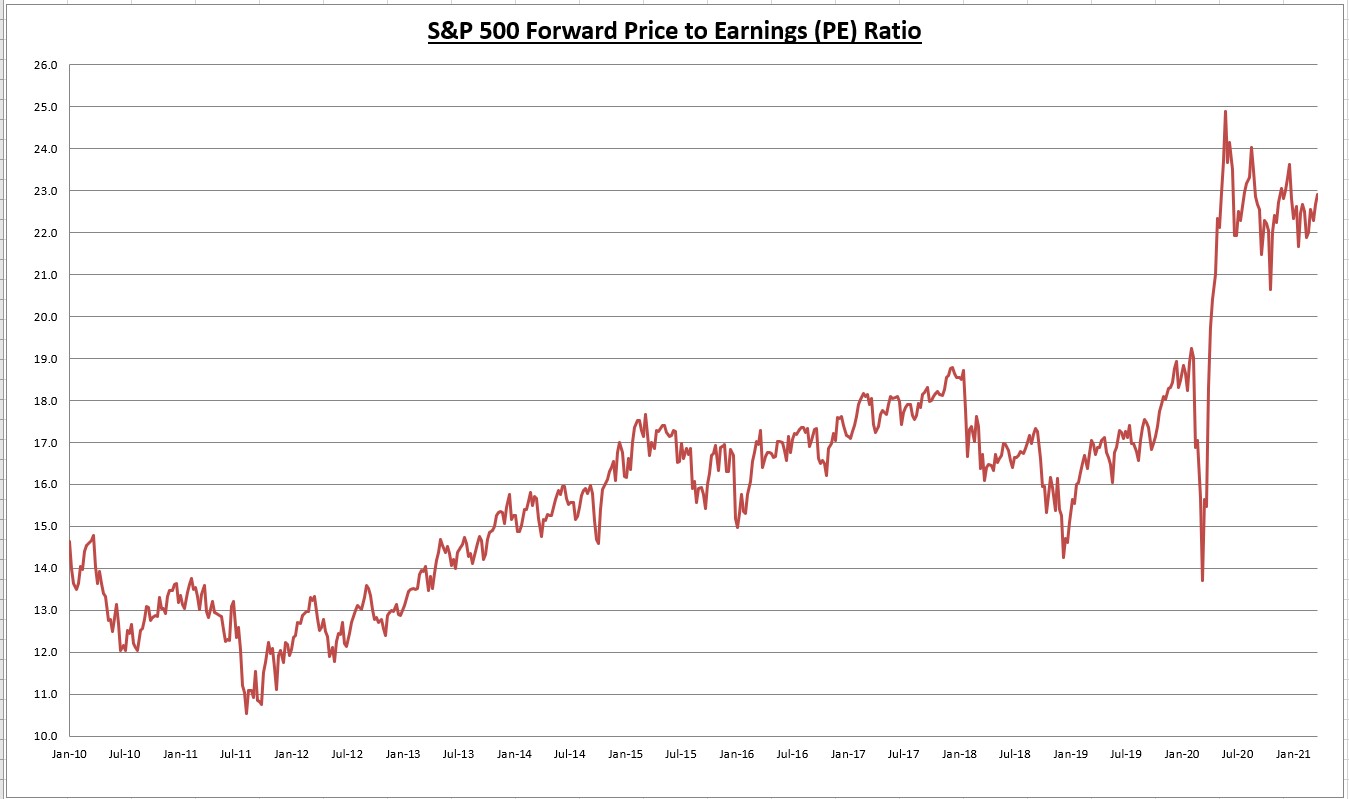
The price-to-earnings (PE) ratio increased to 22.9.

The earnings yield on the S&P 500 is now 4.37%, while the 10-year Treasury bond rate is 1.679%. The equity risk premium (earnings yield minus 10-year Treasury rate) is now 2.688%. Valuation, in relation to fixed income alternatives, is not as attractive as it was months ago, but it still favors stocks by a fairly comfortable margin.
Economic Data Review
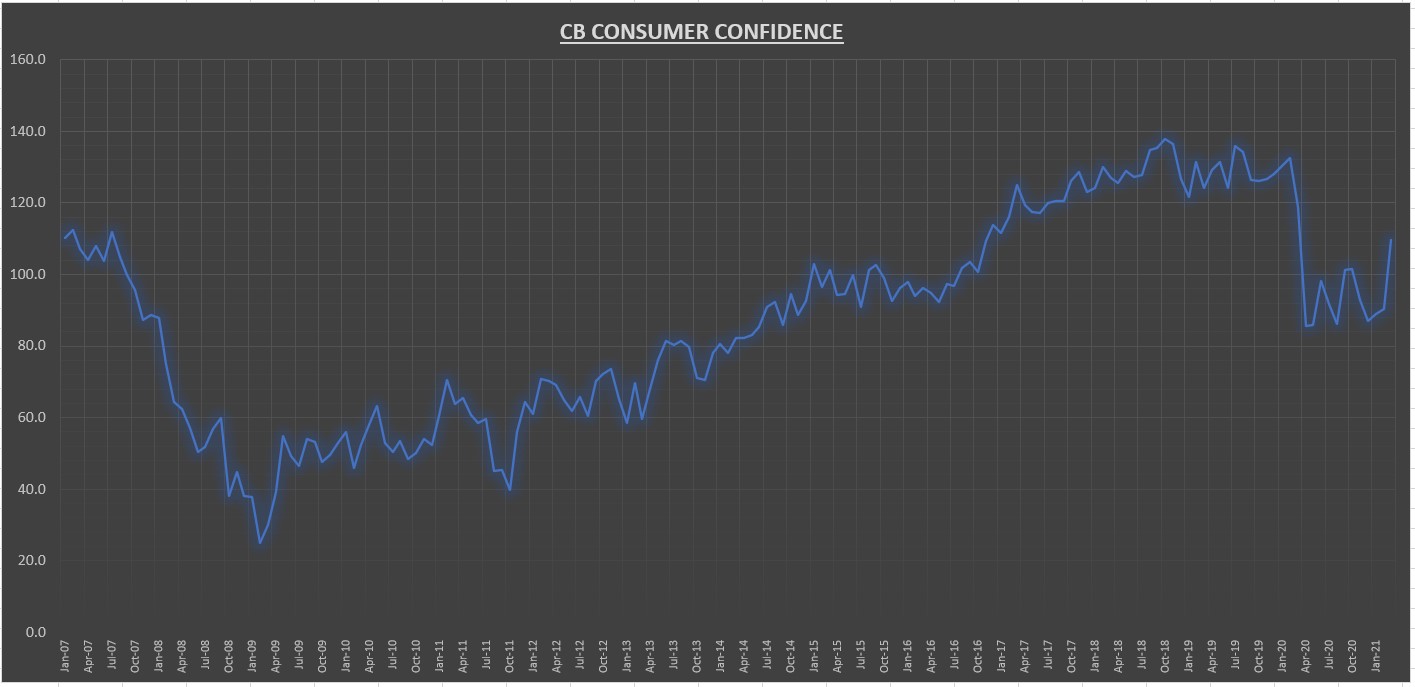
According to the Consumer Confidence Survey, consumer confidence soared in March. The index came in at 109.7, beating expectations of 96.7, a gain of 21% over February (which was revised down from 91.3 to 90.4). The Present Situation Index -- based on consumers’ assessment of current business and labor market conditions -- gained 22.8%, and the Expectations Index -- based on consumers’ short-term outlook for income, business, and labor market conditions -- gained 20.6%.
“Consumers’ assessment of current conditions and their short-term outlook improved significantly, an indication that economic growth is likely to strengthen further in the coming months. Consumers’ renewed optimism boosted their purchasing intentions for homes, autos, and several big-ticket items. However, concerns of inflation in the short-term rose, most likely due to rising prices at the pump, and may temper spending intentions in the months ahead.”

The monthly increase is the highest percentage gain since November 2011.

The index is now at its highest level since March 2020, but still down 8% from this time last year.
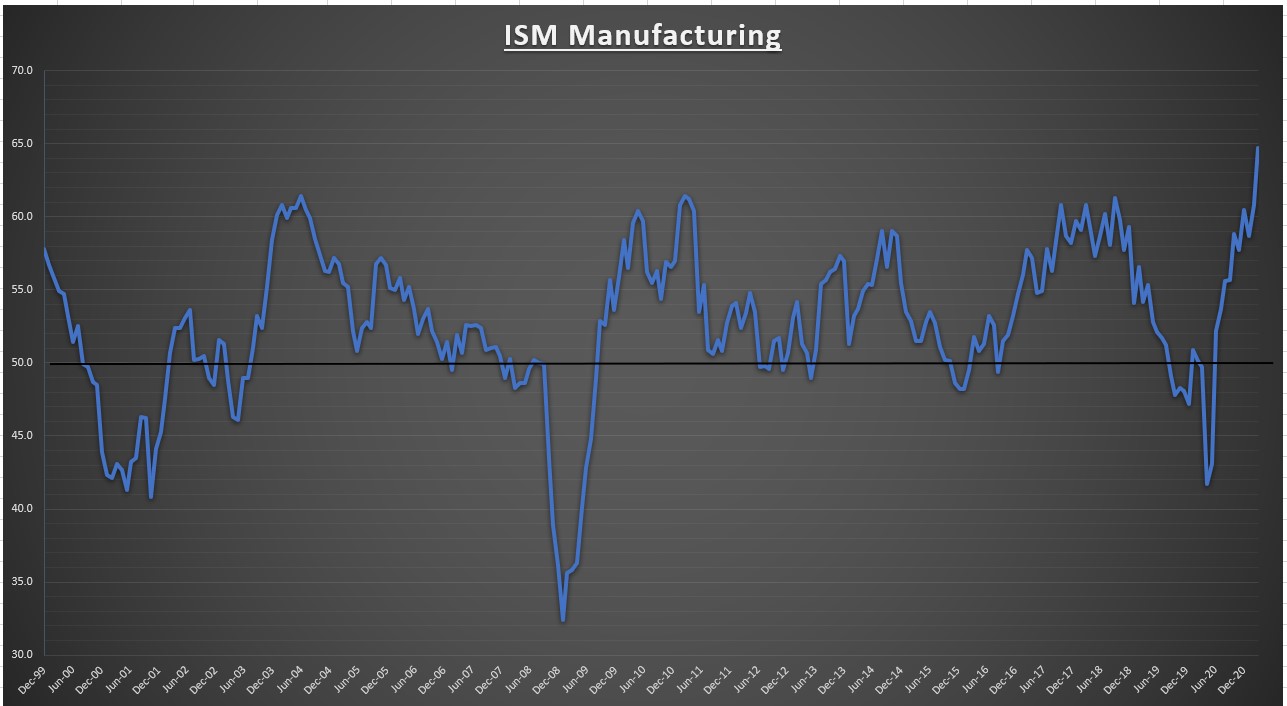
The ISM Manufacturing PMI for March came in at 64.7, well above expectations and the highest number since December 1983. Any number above 50 signals expansion, making this the tenth straight month of growth in the manufacturing sector. All six of the biggest manufacturing indices reported strong growth in March.
“The past relationship between the Manufacturing PMI® and the overall economy indicates that the Manufacturing PMI® for March (64.7 percent) corresponds to a 6.2-percent increase in real gross domestic product (GDP) on an annualized basis.”
Some concerns were noted on capacity and input shortage issues, which could have an effect on future production.
“Survey Committee Members reported that their companies and suppliers continue to struggle to meet increasing rates of demand due to coronavirus (COVID-19) impacts limiting availability of parts and materials. Extended lead times, wide-scale shortages of critical basic materials, rising commodities prices and difficulties in transporting products are affecting all segments of the manufacturing economy. Worker absenteeism, short-term shutdowns due to part shortages, and difficulties in filling open positions continue to be issues that limit manufacturing-growth potential.”
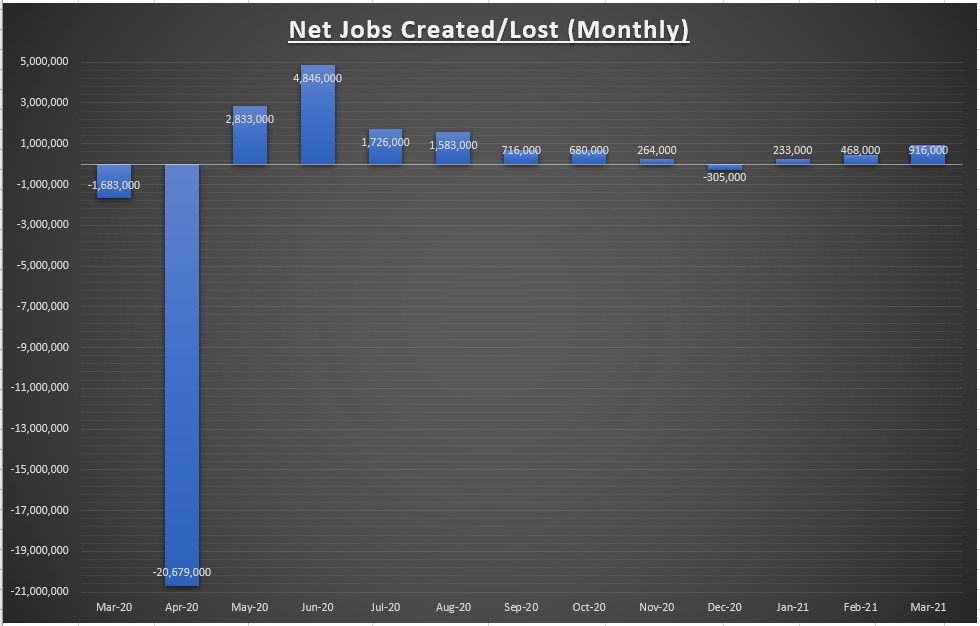
916 thousand net jobs were created in March, well above street expectations of 660 thousand, and the highest number since August. The gains were broad-based, but led by the leisure and hospitality sectors. January was revised higher by 67 thousand net jobs and February was also revised higher by 89 thousand. The unemployment rate is now 6.0%.

We are now 8.4 million net jobs below the pre-COVID-19 high point, recovering about 62.4% of the net job losses so far.
Charts of the Week

The S&P 500 is a market cap weighted index, which means the largest companies make up a larger percentage of the index. The chart above shows the S&P 500 equal weighted index, which means every company is weighted the same, whether its Apple (AAPL) or Microsoft (MSFT) or the 500th company in the index - its all the same.
The chart is helpful to gauge the level of participation in the market. Divergences show up when the index makes a new high, while the equal weighted index does not. This would mean the rally is lacking broad participation by its constituents. However, that is not the case currently. The equal weighted chart above shows that while the S&P 500 makes a new all-time high, the equal weighted index is confirming the advance.
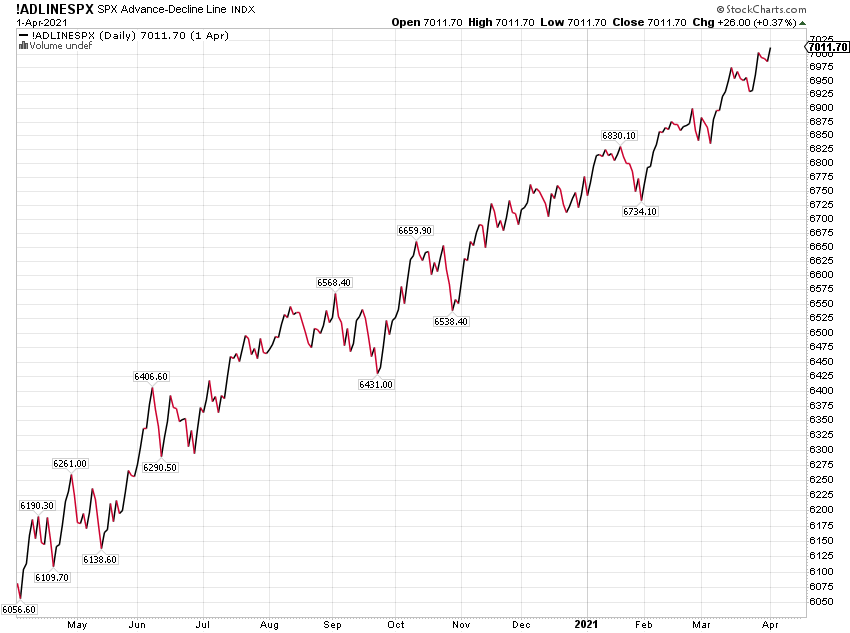
The advance-decline line tells the same story. A broad level of participation continues in this rally. Usually when the market is losing steam and in danger of making a major market top, you begin to see it show up in these indicators. This doesn’t mean it can’t happen, it’s just unusual.
We are told the market can’t advance without the leadership of large-cap tech (FANG). Well, the Nasdaq 100 is 4% below its all-time highs (stocks like Amazon are down 11% from their highs), yet here we are. We’ve seen this happen numerous times in the last decade, yet people keep citing this false narrative.
It’s a healthy rotation, and large-cap tech will have its day in the sun once again. Many of these tech stocks like Amazon (AMZN), Adobe (ADBE), Salesforce (CRM), and Microsoft are sporting very attractive valuations (IMO).
Summary
It was quite a week for fundamental data. Consumer confidence showed a monthly percentage gain increase not seen in a decade, ISM Manufacturing came in at a 40-year high, net monthly jobs created for the month came in about 50% above expectations, and the EPS continues to push towards record highs.
The bond market took it in stride so far, with yields roughly the same as where they were last week. The momentum should continue in the months ahead as the economy starts to reopen. How much good news is already priced in is anyone’s guess. Enjoy the gains, but stay vigilant. Not much more to say. Enjoy the holidays.
Next week we have four S&P 500 companies reporting earnings. For economic data, we have ISM Services on Monday, April 5 and the Producer Price Index on Friday, April 9.
I/B/E/S data from Refinitiv.
Disclaimer: None.


