Signet Jewelers - Chart Of The Day
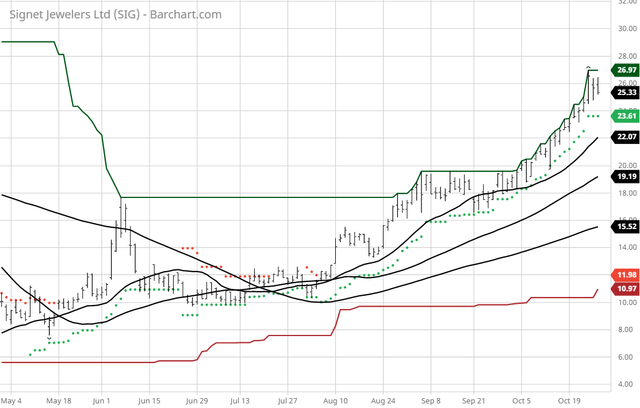
The Barchart Chart of the Day belongs to the retail jewelry chain Signet Jewelers (NYSE: SIG). I found the stock by using Barchart's powerful screening tools to find the stocks with the highest Weighted Alpha and technical buy signals. After I sorted for the most frequent number of new highs in the last month, I used the Flipchart feature to review the charts for consistent prices appreciation. Since the Trend Spotter signaled a buy on 8/5 the stock gained 106.61%.
Signet Jewelers Limited engages in the retail sale of diamond jewelry, watches, and other products. As of February 01, 2020, it operated 3,208 stores and kiosks. The company operates through three segments: North America, International, and Other. The North America segment operates jewelry stores in malls and off-mall locations primarily under the Kay Jewelers, Kay Jewelers Outlet, Jared The Galleria Of Jewelry, Jared Vault, Zales Jewelers, Zales Outlet, Piercing Pagoda, Peoples Jewellers, Gordon's Jewelers, and Mappins Jewellers regional banners; and JamesAllen.com, an online jewelry retailer Website. This segment operated 2,639 locations in the United States and 118 locations in Canada. The International segment operates stores in shopping malls and off-mall locations, principally under the H.Samuel and Ernest Jones brands. This segment operated 451 stores in the United Kingdom, the Republic of Ireland, and the Channel Islands. The Other segment is involved in the purchase and conversion of rough diamonds to polished stones, as well as provision of diamond polishing services. Signet Jewelers Limited was founded in 1950 and is based in Hamilton, Bermuda.
Barchart's Opinion Trading systems are listed below. Please note that the Barchart Opinion indicators are updated live during the session every 10 minutes and can therefore change during the day as the market fluctuates. The indicator numbers are shown below therefore may not match what you see live on the Barchart.com website when you read this report.
Barchart technical indicators:
- 100% technical buy signal
- 122.25+ Weighted Alpha
- 46.84% gain in the last year
- Trend Spotter buy signal
- Above its 20, 50, and 100 day moving averages
- 15 new highs and up 39.56% in the last month
- Relative Strength Index 71.90%
- Technical support level at 24.86
- Recently traded at 25.33 with a 50 day moving average of 19.19
Fundamental factors:
- Market Cap $1.34 billion
- P/E 139.68
- Dividend yield 2.88%
- Revenue expected to grow 10.30% next year
- Earnings estimated to increase 2,380.00% next year and continue to compound at an annual rate of 7% for the next 5 years
- Wall Street analysts issued 2 strong buy, 3 buy and 8 hold recommendations on the stock
- The individual investors following the stock on Motley Fool voted 96 to 34 that the stock will beat the market
- 8,810 investors are monitoring the stock on Seeking Alpha
Disclosure: None.


