
Should We Be Worried About Valuations?

The State of the Market
If you want to start an argument about the state of the stock market, the topic of valuations is usually a pretty good place to start. And to be sure, the topic is fairly complex. For example, valuation levels morph over time. What was extremely overvalued from 1925 through 1985 has become the low end of the range for the last 35 years.
Then there is the issue of absolute valuations versus relative valuations - meaning the level of valuations relative to interest rates. The simple point here is that when rates are high, they can be viewed as competition to stocks (especially those dividend-paying companies). Conversely, when rates are low, it can be argued that stocks are a better way to try and generate income. As such, demand for stocks is higher when rates are low. Especially when rates are at either generational or all-time lows, which is an environment we've been in for quite some time now.
However, in perusing the dozen or so valuation metrics I review each month (including various measures of P/E's, Price-to-Dividends, Price-to-Sales, Price-to-Book, etc.) there can be no arguing that valuations - especially absolute valuations - are either at or near record highs.
Yes, I said it; some valuation metrics are at record highs. Go ahead and let that sink in. Kinda gives you a chill, doesn't it?
With this data currently being splashed everywhere, even grizzled veterans of the stock market game can be seen/heard paying attention to and/or questioning valuations. So, the question of the day becomes, should investors be thinking about heading to the sidelines? Or at the very least, taking some chips at the table?
The Short Answer
Cutting to the chase, the short answer is, maybe yes, maybe no.
You see, valuations tend to become extreme for two basic reasons. First, when the economy experiences a recession, it follows that the E (earnings) in the P/E ratio falls. But then as stocks begin to discount better days ahead, the P (price) rises. The key here is to understand that this causes the P/E ratio to surge because the P is rising while the E is still falling. So, we tend to get extremely high P/E ratios as the economy emerges from recessions. Sound familiar?
The second scenario is more problematic and occurs when a bubble or overexuberance is present. This is simply a case of expectations (current stock prices) becoming detached from reality (actual earnings). To be clear, this is a bad thing. The technology bubble of 2000 and the mania in 1987 were good examples of P/E's becoming extreme due to investor enthusiasm.
Where Are We Now?
Naturally, the next question is if we are seeing a "bad" overvaluation condition. Or are we experiencing the kind of overvaluation that tends to occur when the economy starts to recover from recession?
I will contend that we're currently experiencing the latter condition. The economy was shut down to try and control the spread of the virus. A severe recession resulted. Then the economy opened back up and a recovery ensued. However, the virus remains a problem and continues to have a negative impact on some parts of the economy.
But with vaccines being put into the public's arms daily and more vaccines on the way, the stock market is looking ahead to better days. As such, the P in the P/E ratio is rising - rapidly. The result is record high valuations.
That's my story, and I'm sticking to it.
Is It a Good Time to Sell?
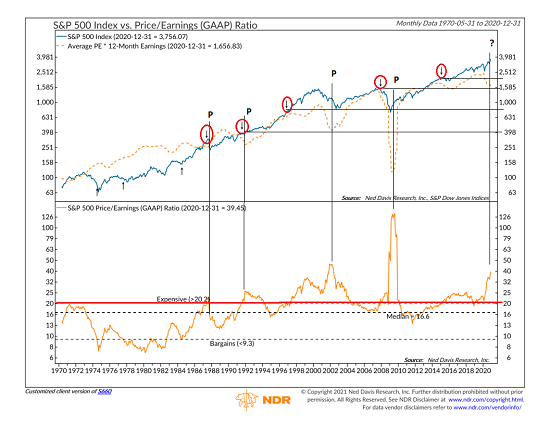
However, there are times when taking some risk off the table when valuations become extreme does indeed make sense. Below is a chart of the S&P 500 and the GAAP P/E ratio. The red circles represent when valuations became "expensive" in the past. The "P's" on the chart indicate when the P/E ratio peaked (something that can only be known with the benefit of hindsight).
(Click on image to enlarge)
* Source: Ned Davis Research
As you can see, selling when valuations first became extreme (the red "Expensive" line in the lower clip), worked out beautifully in 1987 and in early 2008. However, such a plan was a complete failure in 1991, 1996, 2015 and in 2018.
For example, if you had sold when the P/E first became expensive in 1991 (8/31/1991 - with the S&P sitting just below 400), you would have missed out on one of history's all-time great bull market runs as the S&P rose roughly 275% before peaking in the late summer of 2000.
The same can be said to a certain degree with the 1996 signal as the S&P nearly doubled in the ensuing 3.75 years. And a similar situation occurred after the signal seen in February 2015 when the S&P was around 2050. Same thing happened again on a repeat signal that isn't shown that occurred on 1/31/2018, as the index has risen over 40% since.
So, if you believe that valuations are extreme due to the market becoming overheated and detached from earnings reality, then, yes, it makes sense to take some chips off the table. Or at the very least, take your foot off the gas in your portfolio by lowering the beta of your holdings.
But, if you believe that the economy is going to return to normal in the next 6 - 9 months, then it is probably okay to, "Party on, Wayne.
My take is that my crystal ball is in the shop (again!) and I simply don't know what will happen next. As such, I'm splitting the baby here by reducing exposure in my aggressive portfolios and taking the beta down a smidge in others. At least until the macro outlook becomes a little clearer, anyway.
Now let's turn to the state of my favorite big-picture market models...
The Big-Picture Market Models
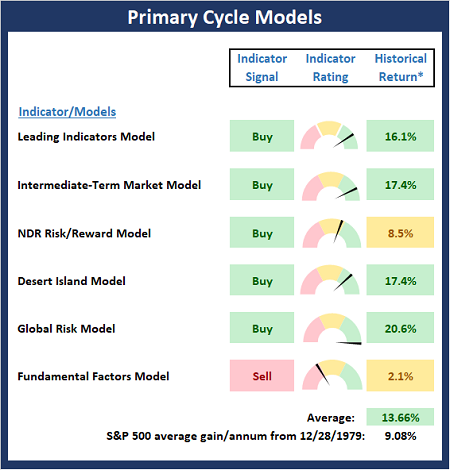
There are no changes to report on the Primary Cycle board this week. And with the five out of six models currently in healthy state, I believe it is best to continue to give the bulls the benefit of the doubt.
* Source: Ned Davis Research (NDR) as of the date of publication. Historical returns are hypothetical average annual performances calculated by NDR.
Fundamental Factor Models
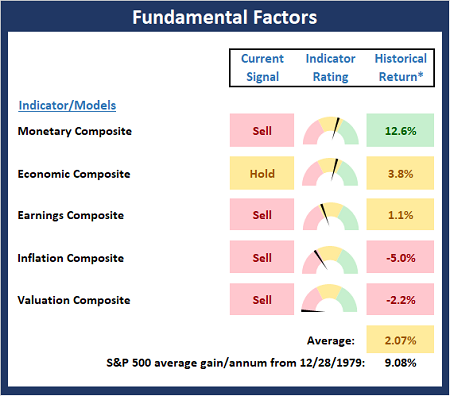
There are no changes to the Fundamental board this week. However, as I pointed out last week, it is important to recognize that there are no buy signals on the board at this time. So, from my seat, the takeaway is that risk is elevated. For me, this means that this is not the time to have the pedal to the metal.
(Click on image to enlarge)
* Source: Ned Davis Research (NDR) as of the date of publication. Historical returns are hypothetical average annual performances calculated by NDR.
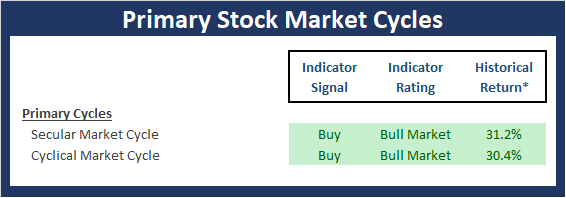
"Primary" Cycle History
I have found that checking in on state of the cycles and the weekly/monthly charts helps to keep the big-picture in perspective.
(Click on image to enlarge)
* Source: Ned Davis Research (NDR) as of the date of publication. Historical returns are hypothetical average annual performances calculated by NDR.
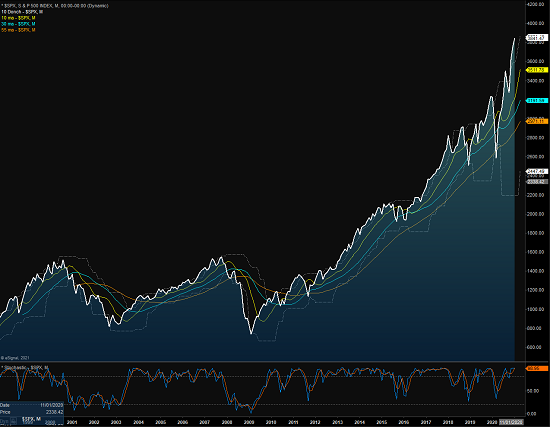
The Secular Market Cycle
Below is a monthly chart of the S&P 500 Index illustrating the current cycle, which we estimate began on March 9, 2009.
S&P 500 - Monthly
(Click on image to enlarge)
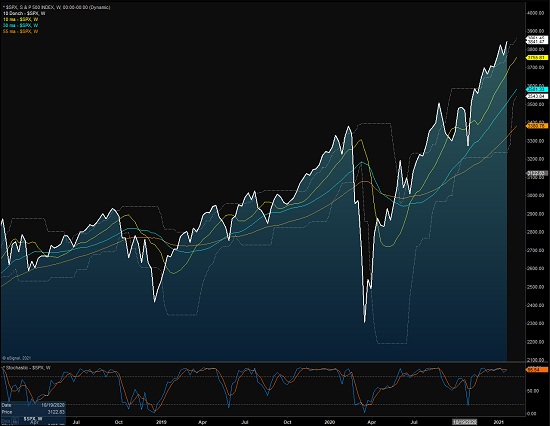
The Cyclical Market Cycle
Below is a weekly chart of the S&P 500 illustrating the current cycle, which we estimate began on March 24, 2020.
S&P 500 - Weekly
(Click on image to enlarge)
The opinions and forecasts expressed herein are those of Mr. David Moenning and may not actually come to pass. Mr. Moenning's opinions and viewpoints regarding the future of the markets should ...
more

