
Short-Term Forecast For Friday, May 15
We are 4 sessions into the beta phase decline of the short-term cycle that began on March 24.
(Click on image to enlarge)
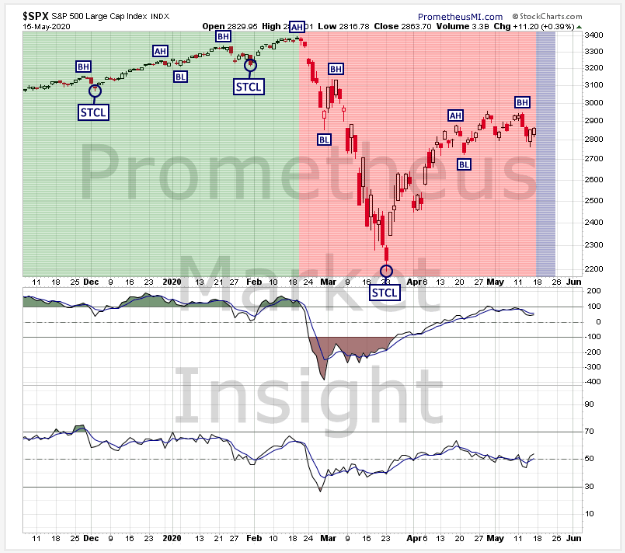
An extended beta phase decline that moves below the last short-term cycle low (STCL) at 2,191 would reconfirm the current bearish trend and forecast additional losses. Alternatively, a quick rebound followed by an extended alpha phase rally that moves well above the last beta high (BH) at 2,940 would signal the likely transition to a bullish short-term trend.
S&P 500 Index Daily Chart Analyses
The following technical and cycle analyses provide short-term forecasts for the S&P 500 index.
Technical Analysis
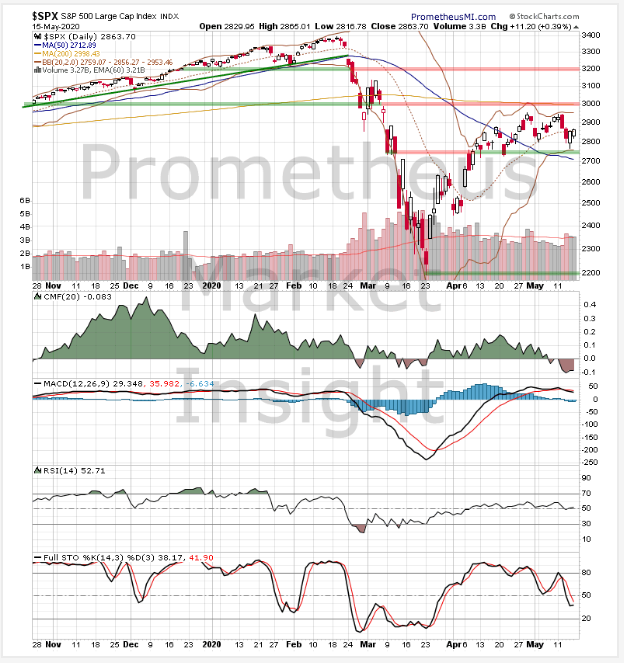
The index closed moderately higher today, moving up toward previous highs of the uptrend from March. Technical indicators are effectively neutral overall, suggesting that direction is in question.
(Click on image to enlarge)
Cycle Analysis
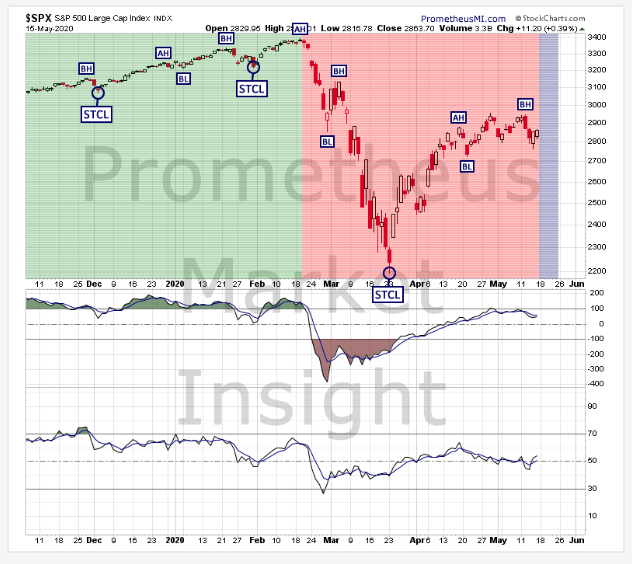
We are 4 sessions into the beta phase decline of the cycle following the short-term cycle low (STCL) on March 23. An extended beta phase decline that moves below the last STCL at 2,191 would reconfirm the current bearish translation and forecast additional losses. Alternatively, an extended beta phase rally that moves well above the last beta high (BH) at 2,940 would signal the likely transition to a bullish translation. The window during which the next STCL is likely to occur is now through May 22, with our best estimate being in the May 18 to May 22 range.
- Last STCL: March 23, 2020
- Cycle Duration: 38 sessions
- Cycle Translation: Bearish
- Next STCL Window: Now through May 22; best estimate in the May 18 to May 22 range.
- Setup Status: No active setups.
- Trigger Status: No pending triggers.
- Signal Status: No active signals.
- Stop Level: None active.
(Click on image to enlarge)
Short-term Outlook
- Bullish Scenario: A rebound and close well above the recent short-term high at 2,940 would reconfirm the uptrend from March and forecast a move up to congestion resistance in the 3,000 area.
- Bearish Scenario: A close below the recent short-term low at 2,794 would predict a return to the 50-day moving average at 2,713.
The bearish scenario is slightly more likely (~60 probable).
We will identify the key developments moving forward as they occur in our daily market forecasts and signal notifications available to paid subscribers. Try ...
more

