
Screening For The Best Growth Stocks
Investing in companies with superior growth rates can produce outstanding returns over the long term. A stock is essentially a share in the ownership of a business, and the price of the stock will follow the value of the business over time. When the business is growing rapidly and ideally accelerating, investors can be rewarded with exponential returns.
On the other hand, investing in high growth stocks is not for the faint of heart. These kinds of companies can be particularly volatile and risky. High growth stocks are priced for demanding expectations, and if the company fails to deliver in accordance with those expectations, the stock price will naturally suffer the consequences.
When looking for the best growth stocks, it makes sense to focus on consistent growth leaders with a proven ability to outperform over time. No screener can guarantee future returns, but a track record of consistently strong growth can say a lot about the underlying quality of the business.
Growth Leaders By The Numbers
Finding companies that are growing at a good speed is not enough. Investment decisions should be made by looking through the windshield as opposed to the rear-view mirror. The most important thing is finding companies that can sustain rapid growth in the future and ideally outperform market expectations going forward. This is a critical consideration when screening for the best growth stocks in the market.
The screener considers only companies with a market capitalization value above $250 million to guarantee a minimum size for companies in the portfolio. This has a negative impact on performance since the smaller companies can many times produce the biggest growth rates, but it's still reasonable to include a size floor to guarantee liquidity.
The screener also requires companies to have positive sales growth in the past quarter, and the revenue growth rate has to be above the industry average over three different timeframes: The most recent quarter, a trailing twelve-month period, and the past three years.
The main idea is focusing on consistent growth leaders. If the company is outgrowing the competition in multiple timeframes, this is indicating that the business has superior fundamental qualities, such as more innovative technologies, a visionary management team, or differentiated brand power.
These kinds of companies are not easy to find: From a starting universe of nearly 6,500 stocks, we end up with less than 600 names when filtering for size and growth rates over different timeframes.
Among those stocks, we select the 25 names with the highest rankings based on the Stocks on Fire algorithm. This is a ranking algorithm based on two main factors: price momentum and fundamental momentum.
The price momentum factor measures price performance and the fundamental momentum component measures the increase in sales and earnings estimates for the company. We want to focus on companies that are performing better than expected from a fundamental perspective, and we want the stock price to be reflecting this outperformance.
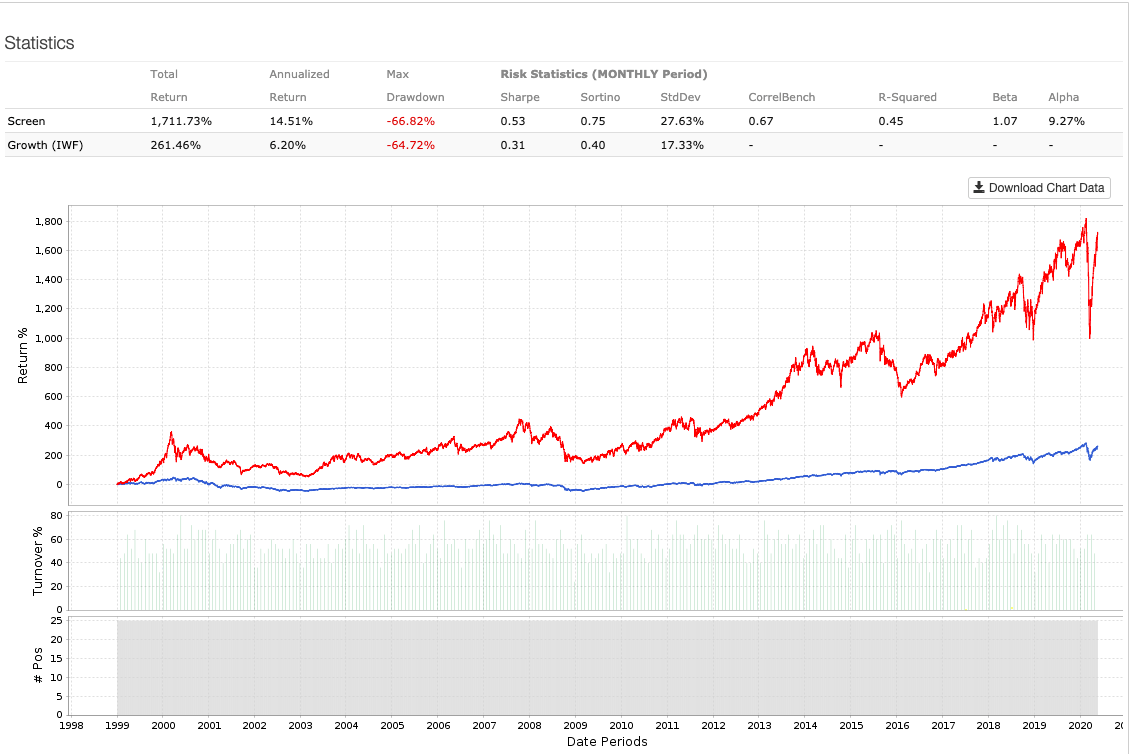
The backtest below picks the 25 stocks selected by the quantitative screen, and it builds a portfolio based on the information available at the time. This means no survivorship bias and no look-ahead bias. The portfolio is rebalanced every four weeks and trading expenses are assumed to be 0.2% per transaction. The benchmark is the iShares Russell 100 Growth ETF (IWF).
Since January of 1999 the strategy has gained 1711% vs. 261% for the benchmark. This means that $100,000 invested in the quantitative strategy in 1999 would currently be worth $1.8 million, and the same amount of capital allocated to the Shares Russell 1000 Growth ETF would have a much smaller value of $361,00. Alpha amounts to 9.27% per year.
(Click on image to enlarge)
Data from S&P Global via Portfolio123
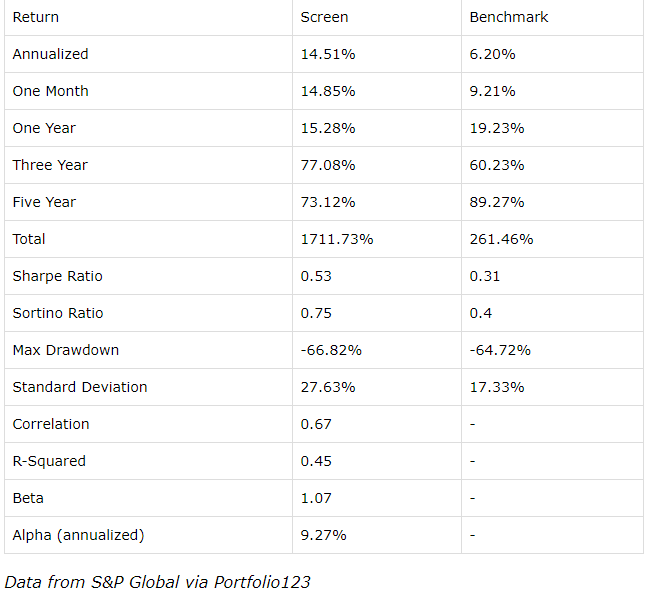
Providing more details, the table below shows return and risk statistics for the quantitative screener and the benchmark over different timeframes. It's important to note that the screener outperforms since inception, in the past year, and in the past three years. However, the screener also lags the benchmark considerably in the past five years.
This is perfectly normal and should even be expected. No quantitative screener can outperform all the time and for every time period, so we need to be realistic in terms of expectations. Since the screen is far more concentrated than the benchmark, it's also more volatile.
(Click on image to enlarge)
Practical Considerations Screen Results
The quantitative screen is just a list of ideas for further research as opposed to a series of recommendations. The research process begins with the screener, it does not end there.
It's also important to understand that the relative performance of growth stocks will necessarily fluctuate over time. Growth stocks have outperformed both value stocks and the market in general in the past decade and particularly more during the recent ups and downs in the market.
Major economic trends and technological innovations are powerful drivers for growth stocks over the long term. In a world in which economic growth is scarce, companies that can continue growing strongly in all kinds of conditions become increasingly valuable. In addition to this, technological disruption is creating unprecedented opportunities for innovation across different areas and economic sectors.
However, nobody should be too surprised to see some kind of reversion to the mean in the short term. After so many years of massive outperformance from growth stocks, it's reasonable to expect some kind of correction or at least a slowdown in the short term.
A major risk factor to consider when investing in growth stocks is valuation. These kinds of companies usually trade at demanding valuation levels and especially now that growth stocks have been doing so well in the past several years.
One way to approach this problem would be including some criteria for valuation in the screening process. However, that can be too short-sighted. The best growth stocks in the market deserve above-average valuation ratios, and the true value of the business depends on the cash flows that the company is going to produce in the long term. Ratios such as price to earnings are generally too limited since current earnings are underestimating the company's long-term earnings generation in many cases.
Valuation should always be considered, but it's important to asses each company based on its own long-term potentiality as opposed to simply running valuation ratios on companies with different strengths and risks.
Without further prologue, the table below shows the 25 stocks currently selected by the screener. Data in the table also includes market capitalization in millions and revenue growth rates in the past quarter, on a trailing twelve months basis, and in the past three years.
| Ticker | Name | Mkt cap | Growth Qtr. | Growth TTM. | Growth 3Yrs |
| AGI | Alamos Gold Inc | $3,287 | 13.32 | 10.89 | 12.31 |
| ARVN | Arvinas Inc | $1,716 | 55.38 | 217.62 | 86.09 |
| AUDC | Audiocodes Ltd | $1,054 | 11.69 | 14.06 | 11.22 |
| BTG | B2Gold Corp | $5,724 | 44.06 | 25.04 | 19.14 |
| BAND | Bandwidth Inc | $2,595 | 28.5 | 21.22 | 15.2 |
| DXCM | DexCom Inc | $36,916 | 44.42 | 41.93 | 37.06 |
| DOCU | DocuSign Inc. | $23,340 | 37.63 | 38.95 | 36.68 |
| OTCPK: DPMLF | Dundee Precious Metals Inc | $999 | 76.83 | 26.78 | 13.08 |
| EQX | Equinox Gold Corp | $1,961 | 267.49 | 474.19 | 582.26 |
| EVBG | Everbridge Inc | $5,059 | 37.56 | 36.12 | 37.75 |
| EVER | EverQuote Inc | $1,266 | 55.77 | 58.96 | 26.55 |
| GLUU | Glu Mobile Inc | $1,479 | 11.88 | 10.96 | 27.05 |
| IPHI | Inphi Corp | $5,128 | 69.58 | 33.57 | 11.15 |
| KNSL | Kinsale Capital Group Inc | $3,173 | 11.31 | 32.71 | 30.66 |
| QDEL | Quidel Corp | $7,844 | 18.03 | 12.07 | 40.81 |
| OTCPK: RLLMF | Real Matters Inc | $1,455 | 73.34 | 55.36 | 9.07 |
| KRMD | Repro MedSystems Inc | $391 | 27.26 | 34.02 | 23.51 |
| SGEN | Seattle Genetics Inc | $26,893 | 20.14 | 34.78 | 29.91 |
| SHOP | Shopify Inc | $91,201 | 46.65 | 46.49 | 59.45 |
| SYRS | Syros Pharmaceuticals Inc | $446 | 424.01 | 83.08 | 84.22 |
| TDOC | Teladoc Health Inc | $12,687 | 40.62 | 32.55 | 65.01 |
| VRTX | Vertex Pharmaceuticals Inc | $73,739 | 76.5 | 47.6 | 34.73 |
| WING | Wingstop Inc | $3,628 | 15.36 | 26.37 | 24.56 |
| ZM | Zoom Video Communications Inc | $48,911 | 77.93 | 88.39 | 117.14 |
| ZYXI | Zynex Inc | $624 | 65.59 | 50.43 | 50.6 |
Disclosure: I am/we are long DOCU.
Disclaimer: I wrote this article myself, and it expresses my own opinions. I am not receiving compensation for it. I have no business relationship with any ...
more

