
ROKU ElliottWave Corrective Structure Suggesting A Recovery
ROKU investors had great hopes for 2018 as the streaming TV platform continued it outstanding growth in addition to its stock price surging to new all-time highs. However, in just 3 months, the stock erased all gains to end up with -40% similar to the rest of the stock market in 2018.
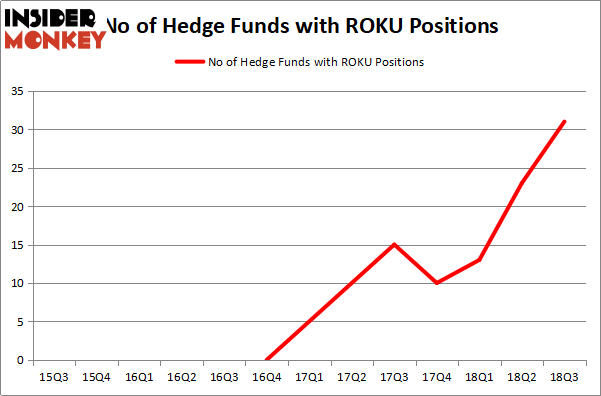
The company earning report and steady growth attracted all type of investors and Hedge Funds interest in the stock grow as their number increased significantly in the previous quarter as we can see in this graphic.
Can ROKU recover in 2019 and turn the table around?
The stock rally since IPO failed to achieve an impulsive 5 waves advance and ended up as 3 waves Zigzag structure. The take profit took place at the blue box area $72 - $82 which triggered the sell-Off.
The decline from October peak is taking the shape of a 7 swings move and it reached the measured Fibonacci target at 100%-$123.6 area $30.6 - $23.8. The pattern is an Elliott Wave corrective structure called Double Three which ideally would produce in this case at least a bounce to the upside to correct the previous cycle.
ROKU Daily Chart 1.2.2019
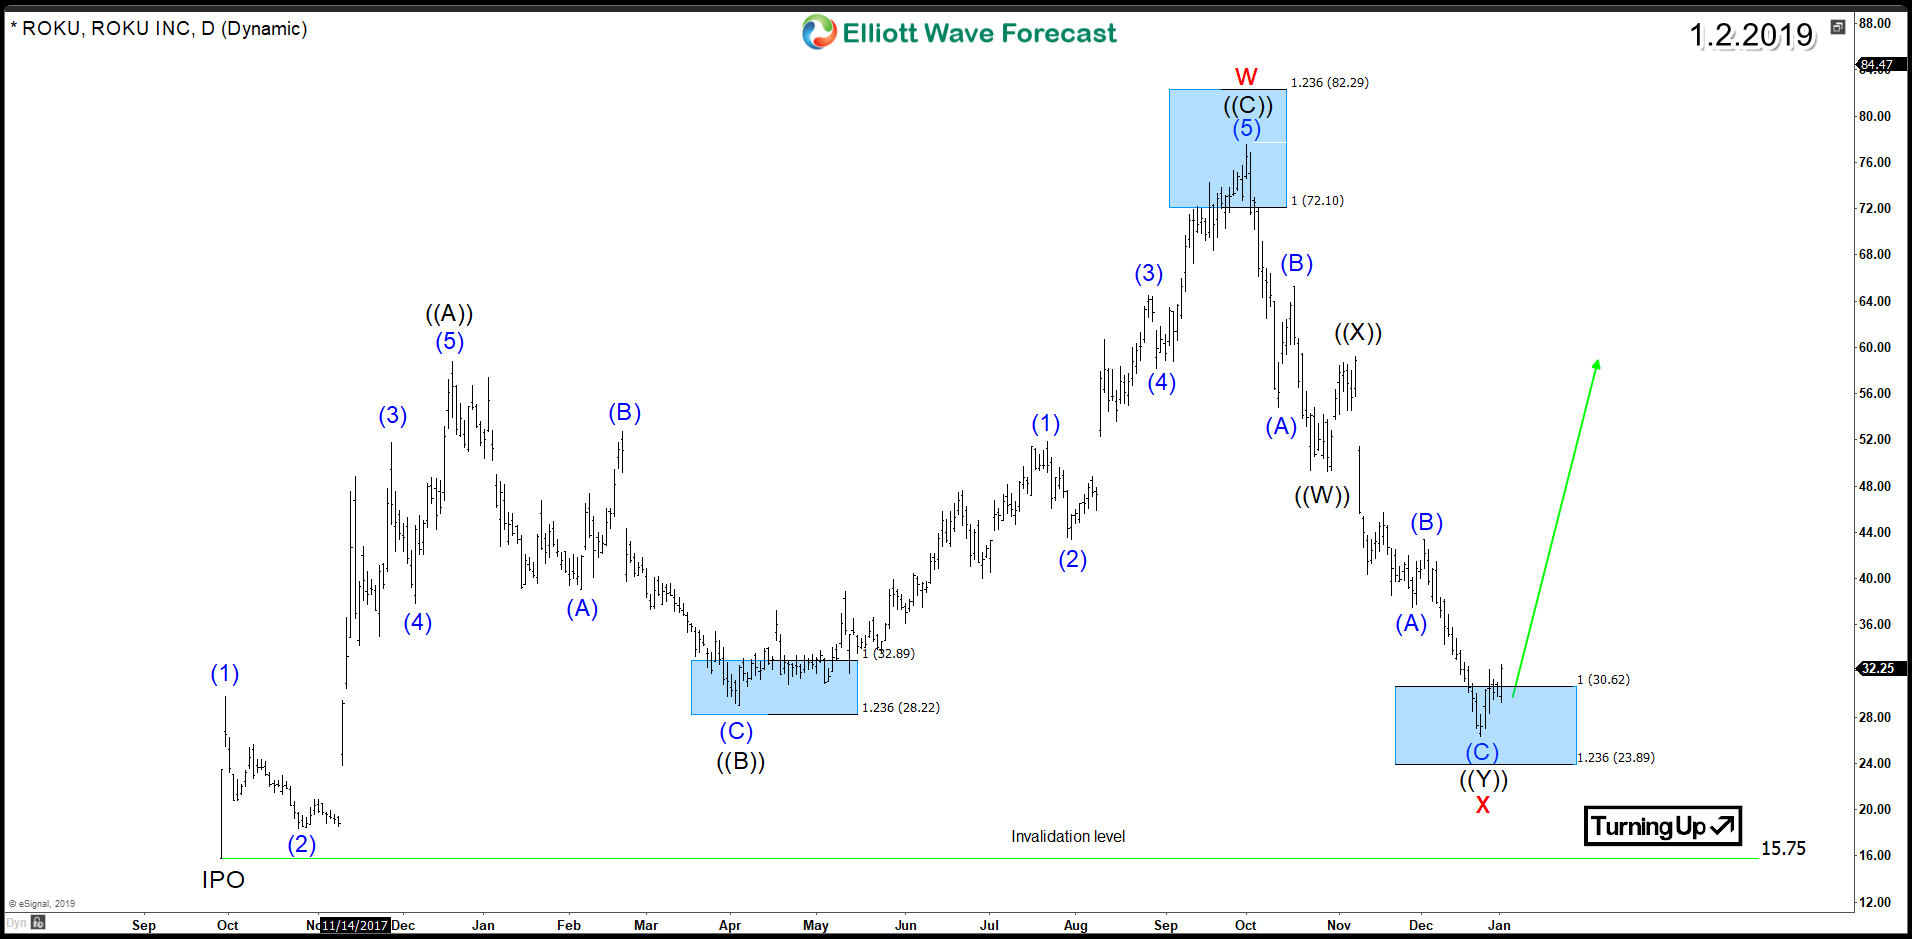
Consequently, as long as ROKU remain above its IPO low $15.75 then it will be looking for a recovery toward $50 - $60 then the stock can decide if the new cycle can take it higher toward $88 and above or a larger move lower will follow.
Disclaimer: Futures, options, and over the counter foreign exchange products may involve substantial risk and may not be suitable for all investors. Leverage can work against you as well as for ...
more

