
ROIC Analysis: Value Destruction From Growth And Other Pitfalls

Image Source: Pexels
Something that might shock the average investor is that growth can actually lead to value destruction for a company, depending on how a company is achieving that growth. Using ROIC analysis and comparing it to a company’s cost of capital, we can quickly determine when that is happening and steer clear from these types of investments.
In order to understand why cost of capital is important, especially in its relation to ROIC (Return on Investment Capital), we need to understand what cost of capital is. Cost of capital can be thought of in two ways:
- The company’s cost of acquiring capital. This could be something as simple as the interest rate paid for new debts.
- The opportunity cost for investors. Going back to our simplified example, the company with a 1% ROIC is not doing the shareholder any favors when that money could’ve been reinvested elsewhere to earn higher returns, making an investment in the company as a whole a poor investment.
In either case, a company must earn a higher return on its capital than the cost of capital, otherwise it will drive its value to the ground. And in a rational market, a company can’t continue to earn lower returns (or ROIC) compared to its cost of capital, as eventually that value drops to zero. Let’s take a simplified example of a company whose cost of capital through debt funding is higher than ROIC, and thus destroys value.
Example: Cost of Capital and Value
Say our company’s cost to borrow is 8%, and their ROIC is 5%. Assume also that the initial value of the business is $10,000 and it earned $2,000 in the first year. Assume the company paid all of the $2,000 in earnings in a dividend, and then borrowed $3,000 over 10 years to fund expansion.
- At a 5% ROIC, the company adds $150 in growth.
- At a 8% cost to borrow, the company adds $240 in interest charges.
After you net the interest charges and new growth, the company actually earns $1,914 in profit the next year compared to the $2,000 from year one. Value is being destroyed. This is pretty obvious, as you can see growth is actually decreasing even though earnings are reinvested.
But value can be destroyed in a more sinister way, such as when the cost of capital refers to opportunity cost and can be harder to detect. Say the cost of capital for a company was still 8%, in this case they are issuing shares instead of adding debt.
The 8% of shareholder dilution will offset the growth from 5% ROIC, which nets a decrease in earnings per share even though the company itself grew $150 in earnings. From a company standpoint, the growth looks solid; from a shareholder perspective, value was obviously destroyed. Even that is obvious from an EPS perspective, though.
Where true opportunity cost matters is where a company’s cost of capital is higher than ROIC, which means if the company issued shares, they would’ve tangibly destroyed value, but maybe they didn’t actually do this explicitly. Instead, by reinvesting the earnings for growth at lower rates, the company compounded capital less optimally for the investor who could’ve put the money elsewhere.
Eventually, that destruction of value shows up in a company’s market value, as it becomes clear that earnings will never be distributed back to shareholders, and/or the company is stuck on a treadmill of reinvesting for low returns at high costs of capital to maintain its status quo—essentially burning gobs of cash in the process.
A great chart which describes perfectly the real world effect on value destruction vs. creation as it relates to ROIC and cost of capital (or WACC) comes from McKinsey and Co:
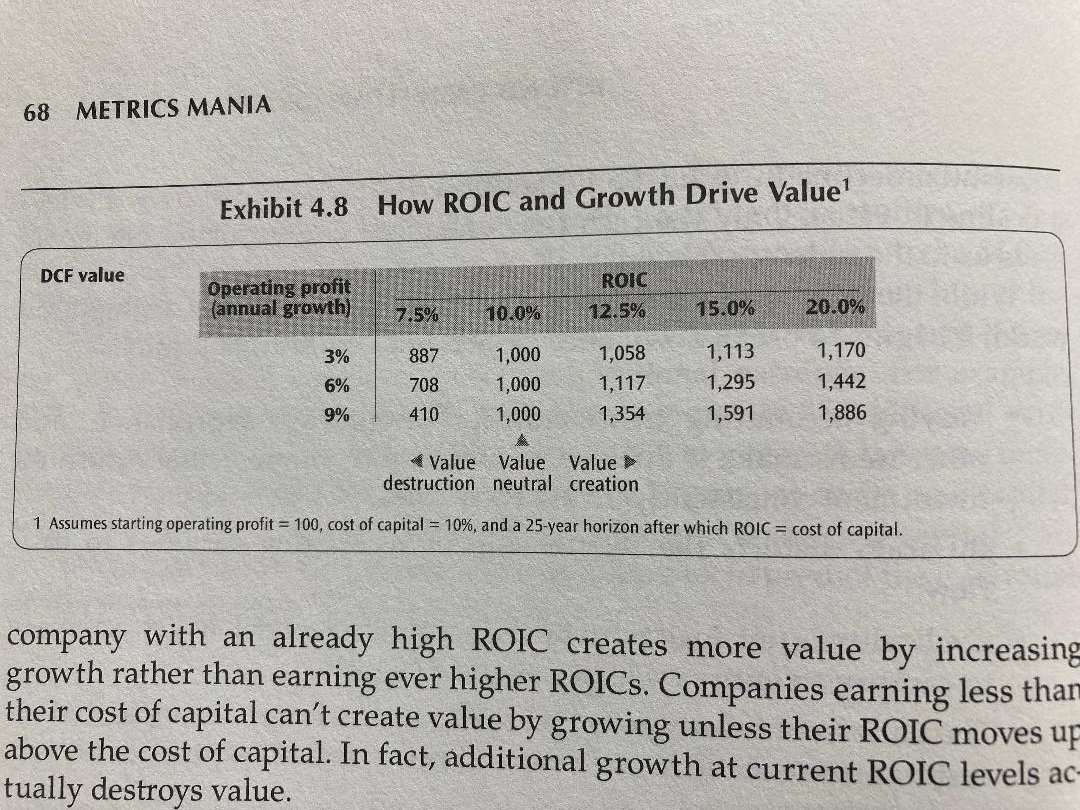
Essentially, you need to compare a company’s ROIC to its WACC.
- If ROIC is greater than WACC, then growth will create value for a company.
- If ROIC is less than WACC, then growth will destroy value over time.
Dave went into a fantastic in-depth post about the critical relationship between company ROIC and WACC (weighted average cost of capital), which I highly recommend reading as well.
ROIC vs WACC: Very Important as It Includes Leverage
Leverage, or debt, can be a double-edged sword for companies. On the one hand, interest expense is tax deductible, and borrowing money at low interest rates to boost long-term growth (and ROIC) can be a great way to allocate capital. On the other hand, too much leverage can cripple a business over the long-term, especially if the uses of the leverage do not create enough future earnings power to pay off the debt.
One potential pitfall of ROIC: ROIC does not include leverage.
This is actually an attractive feature of ROIC because of what ROIC is trying to measure. ROIC tries to encapsulate the performance of the operating portion of a business. What the CFO is doing with debt, which is outside of operations, can skew Net Income due to debt interest payments inclusion in the calculation.
This is why NOPAT is used instead of Net Income for calculating ROIC. A company could be prudently levering up its business to scale up operations for long-term growth investments, which would cripple net income, but still have very healthy operating results. NOPAT captures this, since it takes EBIT (or Operating Income) and subtracts Taxes, but doesn’t subtract Interest (becoming like “EBI” or Earnings Before Interest, if you want to think of it that way).
As business school professor Aswarth Damodaran says, leverage is not good or bad. It all depends on how it is being used. But leverage can very much lead to value destruction in the same way it can lead to value creation, if it is not used in moderation. While ROIC won’t catch value destruction from leverage, cost of capital (WACC) will.
Two Parts of WACC Which Include Leverage
To refresh us on the WACC guide which I linked above, WACC, or Weighted Average Cost of Capital, includes three main components:
- Cost of Equity.
- Cost of Debt.
- Cost of Preferred.
For instructional purposes, let’s just focus on Cost of Equity and Cost of Debt as it relates to potential value destruction. Cost of debt is simple to understand, and we covered it somewhat already.
Basically, when a bank (or bond investor) looks at whether to loan money to a company or not, they will look at the earnings power and balance sheet of a company to determine how risky it is. In general, the riskier the loan, the higher the interest rate an investor or lender would demand to compensate them for the added risk.
And so, since Cost of Debt in the WACC calculation includes Interest Rates paid by the company on debt it has issued, the risk of leverage is included in Cost of Debt. Companies with higher debt will borrow at higher rates, which pushes up their Cost of Debt, and this flows into WACC.
Now when we compare this to ROIC, a highly levered company needs to earn a higher ROIC than one that is debt free in order to create value compared to its cost of capital.
The Cost of Equity formula is based on the CAPM formula. In it, a company’s riskiness is summarized by its beta, which measures a stock’s volatility compared to the entire market. Conventional (academic) wisdom says that riskier stocks will have more volatility compared to the market, and so the added risk will be captured in the CAPM and will increase WACC, requiring future free cash flows to be discounted higher.
But even more so than this, a critical detail about the beta for WACC is that the beta which needs to be calculated is a levered beta. The levered beta formula is equal to the following:
- = Unlevered Beta * (1+ (1-t)*(Debt to Equity)).
- Where t = tax rate.
That’s a bit of a mouthful, and you can read about the details of levered beta with some nice examples included here. Basically, a company with more leverage will have a higher levered beta due to the inclusion of Debt to Equity in the formula. This pushes up Cost of Equity, which pushes up WACC.
You can see now that two parts of WACC are affected by a company’s debt load, and both can work together to push up the WACC. Companies with higher leverage need to earn higher ROICs in order to make up for their increased risks from borrowing; in other words, that borrowed capital better be put to good use, otherwise a company is destroying value.
Be Careful With High ROIC, Low Growth Stocks
I read a fantastic piece by Ensemble Capital, a firm who targets high ROIC stocks to try and find the best capital compounders. Basically, high ROIC stocks have huge advantages over low ones, because they usually provide more capital which can be distributed back to shareholders.
If you have two companies with a 5% growth rate, but one company has an ROIC of 10% and one has an ROIC of 30%, the 10% ROIC company has to reinvest $0.50 of each $1 of earnings to grow 5%, while the company with a 30% only has to reinvest $0.17. The rest can go back to shareholders as a dividend or through buybacks.
However, this benefit drops drastically as growth rates fall. Let’s use the same example, but at a 1% growth rate. The 10% ROIC company only has to invest $0.10 of each $1 of earnings to grow 1%, while the 30% ROIC company only has to invest $0.03. Neither company has to reinvest much, which is great obviously, but the advantage to the high ROIC company is less when growth is small than when growth is big.
In other words, at 5% growth the companies had this much in FCF (after reinvestment):
- 30% ROIC = $1.00 – $0.17 = $0.83.
- 10% ROIC = $1.00 – $0.50 = $0.50.
- $0.83 vs $0.50 = 60% more FCF.
When growth narrows to 1%, each company would have this much in FCF after reinvestment:
- 30% ROIC = $1.00 – $0.03 = $0.97.
- 10% ROIC = $1.00 – $0.10 = $0.90.
- $0.97 vs $0.90 = 7.7% more FCF.
The advantage of higher ROIC diminished greatly, and so the valuation gap between each company should narrow much more than when growth was high. As valuation drops for the companies as growth slows, the impact is likely to be greater to the higher ROIC company than the lower ROIC company, as the difference between their FCF situation becomes less pronounced.
Essentially, value is destroyed for investors as valuations come down with slowing growth, and it’s more pronounced with high ROIC stocks than low ROIC ones. If your strategy allows for higher valuations when a company has higher ROIC, watch out for this potential precipitous cliff.
Now, I know there’s so many pieces to ROIC that it can make your head spin.
- High ROIC is great, unless a company has no competitive advantage, at which point competition will almost definitely destroy margins and ROIC in the future (the effect can be even worse if it takes little capital to enter the market).
- High ROIC is great, unless the reinvestment opportunities in the future aren’t the same as in the past, at which point growth will probably slow.
- Low ROIC is a problem, especially if it’s below a company’s cost of capital, unless the low ROIC is temporary and the company can improve margins easily.
- Low ROIC is bad, unless it keeps new entrants from the market, but the ROIC should still be high enough (compared to cost of capital) to create value with growth.
That’s really not even digging deep into all of the possibilities. If it’s overwhelming to you, let me just recommend to try and absorb ROIC over time. Even a few months time is not enough to master the ins-and-outs, and implications, of ROIC. Hopefully this entire post shows you the various implications of growth, ROIC, and Cost of Capital and how it can relate to both value destruction and value creation for a company and investment.
Disclosure: The author doesn't hold any securities that may be listed.


