
Robinhood IPO: Still A Bad Bet For Investors With Alarming Risk
This report updates our July 15, 2021 report for Robinhood’s newly disclosed IPO price range of $38-$42/share.
Robinhood Markets Inc. (HOOD) is expected to debut as a public company on July 29, 2021. At an expected IPO valuation of roughly $35 billion, Robinhood earns our Unattractive rating.
With Robinhood’s expected valuation of $35 billion, investors may have better odds of making money by trading risky meme stocks using Robinhood’s platform than by purchasing Robinhood’s overpriced stock itself.
We think the stock is worth no more than $9 billion and that Robinhood will likely not be able to continue the robust growth it saw in 2020 due to looming regulatory risk, increasing competition, and an undifferentiated service.
Robinhood’s main source of revenue stems from a controversial practice known as payment for order flow. If regulators were ever to outlaw payment for order flow, Robinhood’s revenue would be severely affected, creating an alarming risk for investors.
A $35 billion valuation implies Robinhood will maintain its unprecedented pandemic-era profitability, grow revenue by nearly 3,000% by 2030, and generate more revenue than established rival Charles Schwab (SCHW).
Such a scenario looks unlikely given increasing industry regulation, the decline in customer trust after the meme-stock debacle in January 2021, and increasing competition.
Revenue Model in Regulatory Crosshairs
As the saying goes, “If you’re not paying for a product, you are the product.”
This point applies not only to social media companies, but it also applies to Robinhood. Robinhood has been heavily criticized for its use of payment for order flow (PFOF), which accounted for 81% of its 1Q21 revenue.
While Robinhood argues that payment for order flow allows them to offer free trading to their customers, and it is currently not illegal, regulators argue that payment for order flow violates a broker’s duty to provide the best execution of trades. In June 2021, SEC Chairman Gary Gensler said that the SEC was reviewing payment for order flow, which led to speculation that it could be banned, according to the Wall Street Journal.
Payment for order flow is already banned in the United Kingdom, which not only limits Robinhood’s international expansion but also sets precedent for Congress to enact laws against the practice. An outright ban on payment for order flow would immediately and severely impact Robinhood’s revenue.
If payment for order flow is ever banned, we don't believe Robinhood could continue offering commission-free trading, which would put the company at a significant disadvantage to rivals Fidelity and Charles Schwab. Fidelity and Schwab can afford to continue offering free stock trading without the payment for order flow revenue thanks to their ability to leverage superior scale to generate meaningful revenue from other services, like asset management. Robinhood doesn’t have anywhere near the scale needed to generate enough revenue from other services to offset the loss of payment for order flow revenue.
Lack of Scale is a Critical Business Model Flaw
Robinhood notes in its S-1 that U.S. retail investors have total assets of roughly $50 trillion, which gives the company a large domestic total addressable market. However, the company lacks the scale to profitably compete in such a large market, especially if payment for order flow is banned or more strictly regulated.
Robinhood’s focus on first-time, low-profit investors led the company to sign up a high number of client accounts, but at an average size significantly smaller than most of its competition. Per Figure 1, Robinhood holds less than 1% of the combined assets of five larger peers and lacks the scale to generate enough revenue to compete with incumbents if PFOF is curbed or banned.
Figure 1: Robinhood’s Client Assets Are Tiny Compared to Peers (2020)
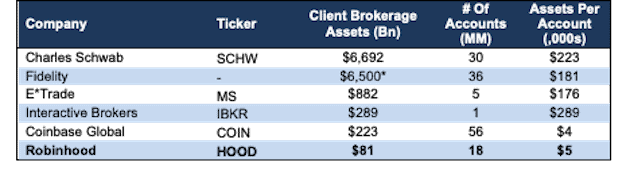
Sources: New Constructs, LLC and company filings. Fidelity data is available here.
*Estimate based on $10.4 trillion in customer assets at Fidelity minus $3.9 trillion in “Discretionary Assets” or assets in managed accounts that Fidelity has the discretion of how they’re invested.
Business Model Built On Conflict of Interest
With payment for order flow generating 81% of the company’s revenue, Robinhood has a clear incentive to generate and sell as much order flow as possible. Not surprisingly, the company has proven it is good, maybe too good, at enticing users to trade. The problem is that more trading is not always prudent for clients. Regulators and clients agree.
- Robinhood recently agreed to pay a record $70 million settlement after a FINRA investigation into giving options trading to unqualified investors.
- This settlement comes after a lawsuit filed by the family of 20-year-old Alex Kearns, who committed suicide in June 2020 after Robinhood misinformed him about how much money he lost trading options.
- The state of Massachusetts filed a lawsuit against Robinhood to revoke its license to operate in the state based on claims of “gamifying” investing and predatory business practices.
Given the large investment in hiring former FINRA and SEC employees, we think Robinhood might be bracing for more regulatory action. In May 2020, Robinhood hired former SEC Commissioner, Dan Gallagher, as its new Chief Legal Officer and paid him ~$30 million in 2020 for just seven months of work. As Michelle Leder noted, $30 million to one lawyer is a lot for a firm without any regulatory concerns.
The mounting regulatory risk Robinhood faces makes us concerned that the public may see Robinhood’s stated goal to ‘democratize investing’ as a ruse to lure them into speculative trading and gambling that benefits Robinhood more than the individual investor. That said, there are many beautiful casinos in Las Vegas that are tributes to the willingness of millions of people to lose money gambling.
Public Trust Is Flagging
In addition to the more than 30 lawsuits brought about by the trading halt debacle in late January, Robinhood has seen a marked drop in customer trust. According to the S-1, in 1Q21, 206,000 users transferred accounts out of Robinhood (~$4 billion of assets), nearly 10x the quarterly average of 22,000.
Many customers are also displeased with Robinhood’s customer service, going as far as showing up at company headquarters amidst the platforms outages during the meme-stock phenomenon. While Robinhood has recently hired hundreds more customer service representatives and has added several new customer service features to the app, its initial lack of focus on customer service has already tarnished its reputation.
Robinhood’s Best Years Are Behind It
While many businesses were crushed during the pandemic-torn economy in 2020, other businesses, like brokerages, thrived. Billions of dollars in stimulus money found its way into the stock market. According to E*Trades’ 1Q20 10-Q, more brokerage accounts were opened on E*Trade in March 2020 alone than in any full year in their history. Robinhood added 3 million accounts in the first quarter of 2020 and has more than tripled accounts since 2019, per Figure 2.
Figure 2: Retail Investors Poured Into Robinhood in 2020
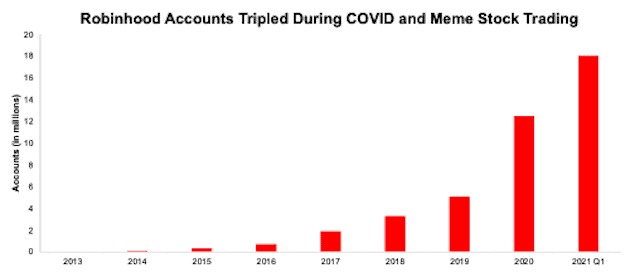
Sources: New Constructs, LLC and company filings.
The influx of retail money flowing into the stock market had the predictable effect of rising stock prices and delivering quick gains to these new market participants. Then, in January 2021, the meme-stock phenomenon drove even more first-time investors to the market. Both of these dynamics led to a surge in Robinhood accounts. Robinhood added 5.5 million accounts in 1Q21, at which point the company had more than tripled funded accounts since 2019.
With increased trading activity came increased payment for order flow, and Robinhood’s revenue grew 245% year-over-year (YoY) and more than quadrupled YoY in 1Q21. Core Earnings[1] grew from -$105 million in 2019 to $78 million over the trailing-twelve-months (TTM). Robinhood’s return on invested capital (ROIC) improved from -11% in 2019 to 5% TTM and NOPAT margin increased from negative 37% to positive 8% over the same time.
With the total number of new COVID-19 cases well below their all-time highs, Americans are going back to their normal lives by leaving their homes, spending less time trading, and spending money on things other than stocks. If this trend continues, Robinhood is unlikely to reach the scale required to justify its valuation.
Undifferentiated Offering
In prior years, Robinhood stood out amongst its peers as the only brokerage offering commission-free trades. The largest brokerages quickly eliminated this competitive advantage by cutting stock commissions in late 2019.
Generally, there is a lack of differentiation between most brokerage businesses. Not only do they all offer 0% commission on stock trades, most offer ancillary services, such as education, a variety of asset classes to invest in, retirement accounts, personalized wealth management, and options trading.
Perhaps, Robinhood’s most differentiating feature, options trading for new investors, has also been a source of significant legal and regulatory costs and challenges, and led famed investor Charlie Munger to call Robinhood “a gambling parlor masquerading as a respectable business.”
A Niche Player in Crypto
Over the past year, Robinhood has been making a distinct push into crypto trading. From 1Q20 to 1Q21, Robinhood’s S-1 shows that the daily average revenue from crypto trades increased from $0.1 million to $1.4 million, or by a factor of 14, and the value of cryptocurrencies held by Robinhood users grew from $481 million to $11.6 billion over the same time.
One advantage that Robinhood has over Coinbase and other crypto brokerages is that Coinbase continues to charge commissions on crypto trades while Robinhood does not. However, we expect a race to zero for trading commissions in the crypto market similar to the one we saw with stock brokerages in 2019. Many other companies already offer low commission crypto trades like PayPal (PYPL) and Square (SQ).
While the growth in crypto assets held by Robinhood’s users was robust ($481 million to $11.6 billion YoY in 1Q21), it still pales in comparison to Coinbase’s custodial crypto assets, which grew from $17 billion in 1Q20 to $223 billion in 1Q21. Additionally, Robinhood only offers seven cryptocurrencies for trading while Coinbase over 40. Robinhood is competing against giants in both stock brokerage, as well as crypto-trading aspects of its business.
Lack of Scale Means Worst-In-Class Profitability
Figure 3 shows that Robinhood’s net operating profit after-tax (NOPAT) margin and ROIC rank below brokerage peers. While the company’s balance sheet efficiency (invested capital turns) ranks second highest of the group, it has not translated into meaningful profit generation.
Figure 3: Robinhood’s Profitability Vs. Competition: 2020
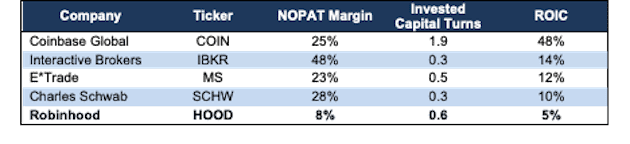
Sources: New Constructs, LLC and company filings
IPO Pricing Implies 128% More Revenue Than Charles Schwab
Below we use our reverse discounted cash flow (DCF) model to analyze the future cash flow expectations baked into Robinhood’s expected IPO valuation. Risk/reward at the expected IPO valuation is unattractive.
In order to justify the IPO valuation of up to $35 billion, Robinhood must:
- improve its NOPAT margin to 16% (compared to -37% in 2019 and 2x 2020 levels) and
- grow revenue by 32% compounded annually through 2030, which is 8x the projected industry growth rate through 2026
In this scenario, Robinhood would generate more than $15 billion in revenue in 2030, which is more than 16x its 2020 revenue and 28% greater than Charles Schwab’s 2020 revenue. Additionally, Robinhood would generate $2.5 billion in NOPAT in 2030, which is more than 31x its 2020 NOPAT and more than double Interactive Brokers’ 2020 NOPAT.
DCF Scenario 2: Growth Is More In-Line with Industry Expectations
We review an additional DCF scenario to highlight the downside risk should Robinhood’s revenue growth fall more in-line with industry expectations.
If we assume Robinhood:
- achieves NOPAT margin of 16% and
- grows revenue by 16% compounded annually from 2021-2030 (4x projected industry growth rates through 2026) then
HOOD is worth just $9 billion today – a 75% downside to the expected $35 billion IPO valuation. See the math behind this reverse DCF scenario.
Figure 5 compares the company’s implied future revenue in these two scenarios to its historical revenue, along with the revenue of other brokerages, such as Charles Schwab and Interactive Brokers.
Figure 4: IPO Valuation Is Too High
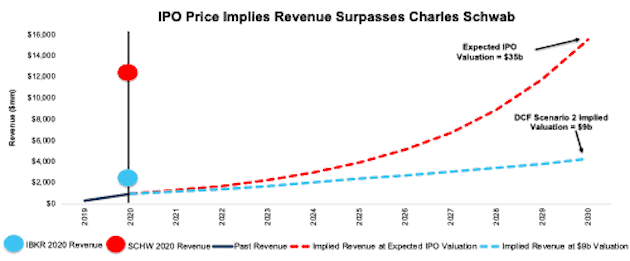
Sources: New Constructs, LLC and company filings
Each of the above scenarios also assumes Robinhood grows revenue, NOPAT, and FCF without increasing working capital or fixed assets. This assumption is highly unlikely but allows us to create best-case scenarios that demonstrate the level of expectations embedded in the current valuation. For reference, Robinhood’s invested capital increased $1.4 billion (146% of revenue) YoY in 2020. If we assume Robinhood’s invested capital increases at a similar rate in DCF scenario 2, the downside risk is even larger.
Additional Red Flags
With a lofty valuation that implies significant improvement in both revenue and profits, investors should be aware that Robinhood’s S-1 also includes these other red flags.
Up to a Third of IPO Shares Will Go to Retail Traders: In its S-1, Robinhood announced that an unprecedented 20-35% of the upcoming IPO shares will be allocated to retail investors on the Robinhood platform. Such high allocation to retail creates more risk, and bankers tend to prefer to allocate IPO shares to institutions, which will hold shares for a long period of time. Retail investors, on the other hand, tend to have shorter investment horizons and are known to trade frequently in and out of stocks to make quick profits, thereby increasing the potential volatility in Robinhood’s stock.
Share Classes Give Investors Little Voice: Robinhood’s S-1 discloses it will go public with three separate classes of common stock. All shares that will be allocated to investors at the IPO will be class A shares while founders and executives will hold class B shares. Class A shares only carry one vote per share while class B shares carry 10 votes per share. Upon completion of this offering, co-founders Baiju Bhatt and Vladimir Tenev will hold around 65% of the voting power in Robinhood.
In other words, investors will have little say over corporate governance once Robinhood is a publicly-traded company since two individuals will hold the majority of voting power.
Adjusted EBITDA Distorts True Profitability
Many companies provide non-GAAP metrics to appear more profitable than they really are, and Robinhood is no different. Robinhood presents the popular Adjusted EBITDA metric as a key performance indicator. Not surprisingly, Adjusted EBITDA gives a more bullish picture of the company’s business than GAAP net income and our Core Earnings.
For Instance, Robinhood’s 2020 adjusted EBITDA removes $24 million of share-based compensation and $102 million for legal and tax settlements, reserves, and expenses. After removing all items, Robinhood reports adjusted EBITDA of $155 million in 2020. Meanwhile, economic earnings, the true cash flows of the business, are significantly lower at just -$2 million in 2020. While the trend in adjusted EBITDA follows the same trend as economic earnings over the past year, investors need to be aware that there is always a risk that adjusted EBITDA could be used to manipulate earnings going forward.
Critical Details Found in Financial Filings By Our Robo-Analyst Technology
Fact: we provide superior fundamental data and earnings models – unrivaled in the world.
Proof: Core Earnings: New Data and Evidence, published in The Journal of Financial Economics.
Below are specifics on the adjustments we make based on Robo-Analyst findings in Robinhood’s S-1:
Income Statement: we made $149 million in adjustments, with a net effect of removing $77 million in non-operating expense (8% of revenue). You can see all the adjustments made to Robinhood’s income statement here.
Balance Sheet: we made $658 million in adjustments to calculate invested capital with a net decrease of $639 million. The most notable adjustment was $9 million in operating leases. This adjustment represented <1% of reported net assets. You can see all the adjustments made to Robinhood’s balance sheet here.
Valuation: we made $2.7 billion in adjustments, all of which decreased shareholder value. The largest adjustment to shareholder value was $2.2 billion in preferred capital. This adjustment represents 5% of Robinhood’s expected IPO valuation. You can see all the adjustments made to Robinhood’s valuation here.
[1] Only Core Earnings enable investors to overcome the flaws in legacy fundamental research, as proven in The Journal of Financial Economics.
Disclosure: David Trainer, Kyle Guske II, Alex Sword, and Matt Shuler receive no compensation to write about any specific stock, style, or theme.


