
Reversal Of Fortune? Bank Index Testing 14-Year Breakout Level
While the 2008 Financial Crisis may be tucked neatly away in history, the devastating blows that the banks took in 2008 still linger today.
This is evident by how severely bank stocks have lagged the broader stock market since the Financial Crisis low in 2009. But not all is lost. In fact, things may be turning up for the Financial Sector and bank stocks. And today’s chart 2-pack highlights why.
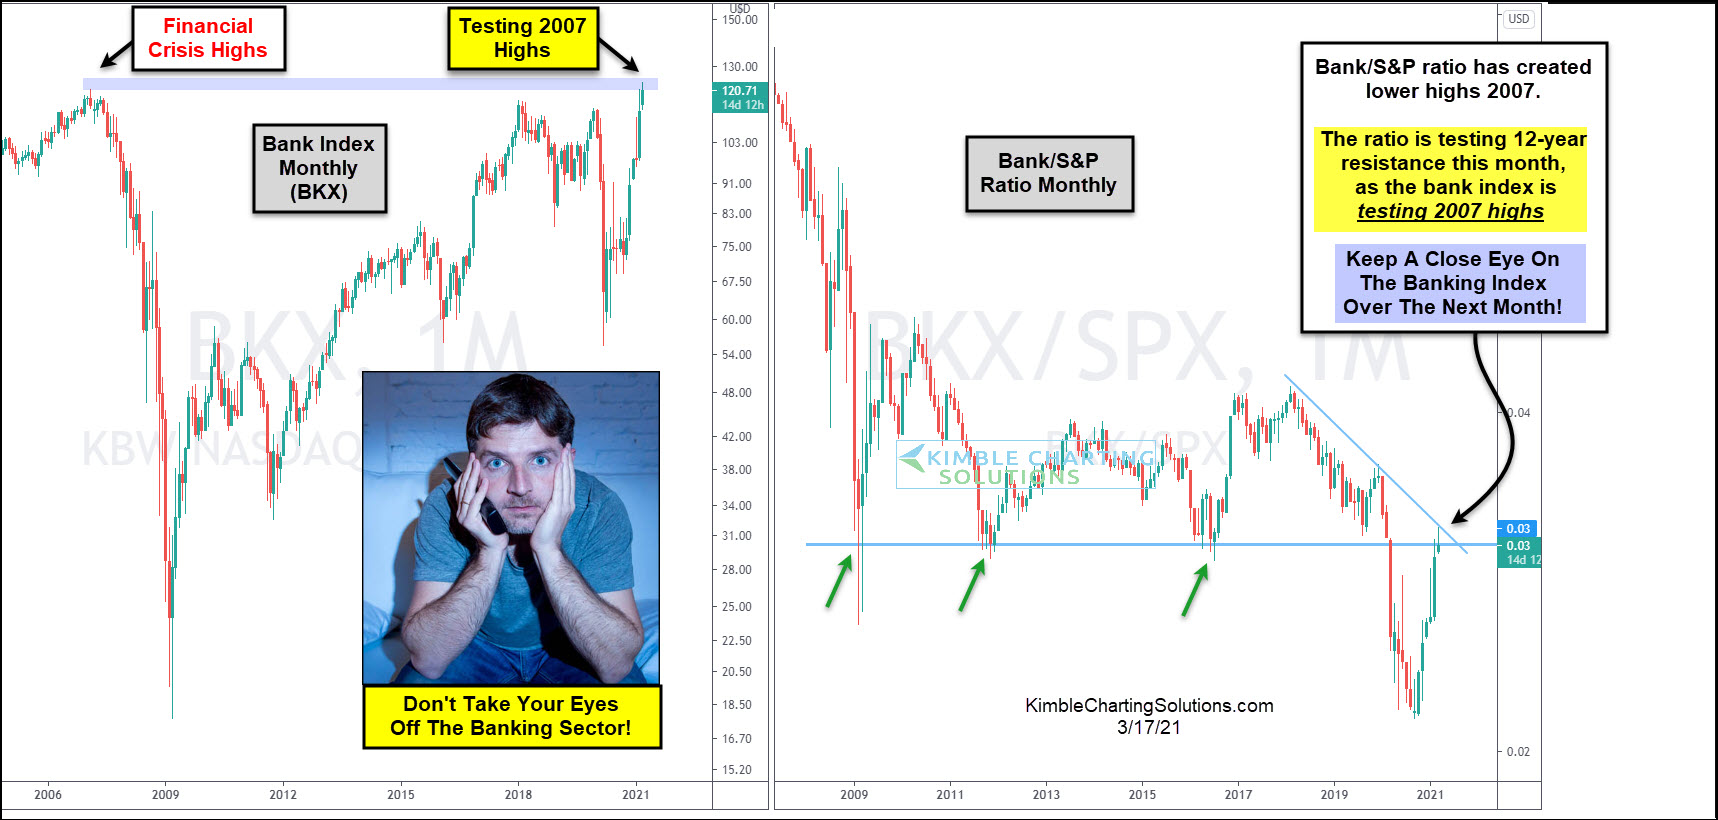
Below is a split look at long-term “monthly” charts of the Bank Index (BKX) and the ratio of the Bank Index (BKX) / S&P 500 Index (SPX).
As you can see, the Bank Index is testing its pre-Financial Crisis highs (left chart). Not a great accomplishment, considering that the S&P 500 is over 2.5x where it traded at the 2007 high.
BUT a bank breakout IS a big deal to market bulls; as a rule of thumb, it’s always good to have the financial sector leading.
The ratio performance chart on the right highlights the decade-long weakness in the banking sector. But, as you can see, this chart also is facing a big breakout test at 12-year resistance (marked by its falling trend line and prior lateral support line).
So is it time for the banks to shine? Only if the bulls see a long-awaited breakout this spring. Stay tuned!
(Click on image to enlarge)
Disclosure: Sign up for Chris's Kimble Charting Solutions' email alerts--click here.


