
Rebuild Your Post-COVID Portfolio With This Industry Leader
It’s not often investors get the chance to buy leading businesses at significant discounts. Investors willing to see through the (inevitable and steep) dip in economic activity can find great value. Investors overlooking D.R. Horton (DHI: $41/share) are in the Danger Zone. Those willing to look beyond the dip in economic activity should consider adding this Long Idea to their portfolio.
DHI’s History of Profit Growth
DHI is down 26% year-to-date (YTD) and trades at its cheapest valuation, as measured by price-to-economic book value (PEBV), since 2006. For investors willing to look past the current crisis, DHI represents a great buying opportunity.
DHI has a strong history of profit growth. Since 2010, DHI has grown revenue by 17% compounded annually and core earnings[1] by 23% compounded annually, per Figure 1. Longer-term, DHI has grown core earnings by 11% compounded annually over the past two decades. The firm increased its core earnings margin from 6% in 2010 to 10% in the trailing-twelve-month period (TTM).
Figure 1: DHI Core Earnings & Revenue Growth Since 2010
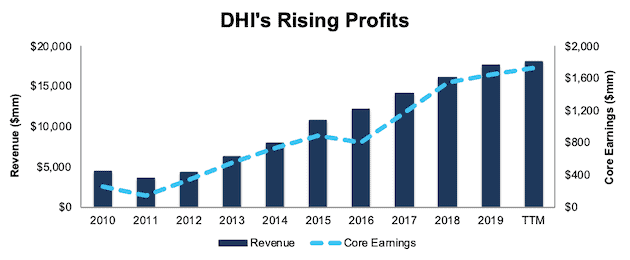
Sources: New Constructs, LLC and company filings
DHI’s rising profitability helps the business generate significant free cash flow (FCF). The company generated positive FCF in each of the past five years and a cumulative $1.5 billion (11% of market cap) over the same time. DHI’s $1.1 billion in FCF over the TTM period equates to a 6% FCF yield, which is significantly higher than the Consumer Cyclicals sector average of 1%.
D.R. Horton’s Balance Sheet Provides Ample Liquidity to Survive the Crisis
Companies with strong cash positions are better positioned to survive macro-economic uncertainty. DHI has the cash to survive the current disruption to operations. The firm recently announced that it ended fiscal 2Q20 (period ended March 31, 2020) with $1.0 billion in unrestricted cash with an additional $1 billion of available capacity on its revolving credit facility. This cash position gives the firm $2 billion of liquidity with only $400 million in debt due within the next twelve months.
In DHI’s latest quarterly filing, the firm spent $456 million ($152 million/month) on selling, general and administrative expense (SGA). In a worst-case scenario where DHI pays down its current debt, generates no revenue, and continues to cover its full SGA expenses, DHI could operate for nearly 11 months before needing additional capital. It is very unlikely that DHI’s revenue would go to zero since the firm is currently building homes. Additionally, DHI would be able to reduce its SGA should a worst-case scenario begin to emerge.
DHI’s Profitability Ranks Highest Among Top Three Builders
COVID-driven disruptions may drive some weaker companies out of business for good.
However, DHI’s profitability was trending higher at a faster pace than its competitors before the crisis. This superior profitability is a testament to DHI’s strong business model, which leverages its economies of scale across the homebuilding industry. With leading profitability, consistent cash flows, and a strong balance sheet, DHI can not only survive the downturn but is well-positioned to grow profits and market share when the economy recovers.
Lennar Corporation (LEN), D.R. Horton, Inc. (DHI), and PulteGroup Inc. (PHM) are the largest home builders in the country based on 2019 revenue. Per Figure 2, DHI’s invested capital turns, a measure of balance sheet efficiency, has improved from 0.9 in 2015 to 1.1 TTM. Meanwhile, the market-cap-weighted average of LEN and PHM’s TTM invested capital turns is much lower at 0.8.
Figure 2: DHI’s Invested Capital Turns Vs. Competitors
(Click on image to enlarge)
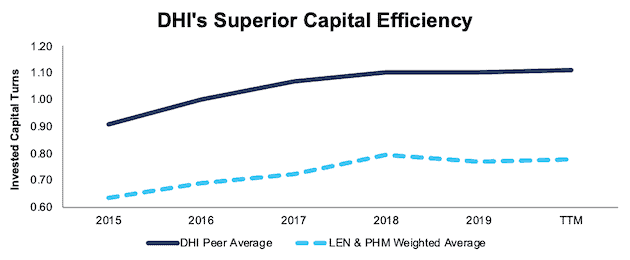
Sources: New Constructs, LLC, and company filings.
DHI has increased its NOPAT margin from 8.3% in 2015 to 9.6% TTM. Meanwhile, LEN and PHM’s market-cap-weighted average has decreased from 10.3% to 9.9% over the same time.
The combination of rising margins and invested capital turns drives DHI’s ROIC higher. DHI has improved its ROIC from 8% in 2015 to 11% TTM. Per Figure 3, the market-cap-weighted average ROIC of LEN and PHM, while improving, has increased at a slower rate than DHI.
Figure 3: DHI’s ROIC vs. Competitors
(Click on image to enlarge)
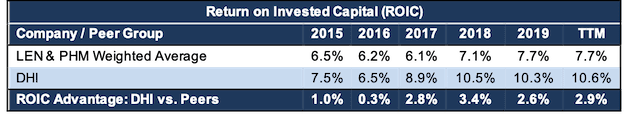
Sources: New Constructs, LLC, and company filings.
Bear Case Assumes Homebuilding Industry Never Recovers
All the recent negativity has bears anticipating the Housing Crisis 2.0 and driving DHI’s price down to levels that imply the current crisis is not temporary but will result in a permanent and severe decline in economic activity. After all, the industry is hampered by excess supply and the challenges of operating while social distancing on construction sites. Demand is also slowing. Preliminary readings of public home closing records indicate that the week ending March 29, 2020, saw a 30% decrease in home sales year-over-year (YoY).
But, we believe these declines and disruptions are temporary, not permanent. Along with the International Monetary Fund (IMF) and nearly every economist in the world, we believe that U.S. GDP growth will be higher in 2021 than expected before the pandemic. Accordingly, it is safe to assume the homebuilding industry will return to something, at a minimum, approaching historical levels.
Meanwhile, bears are pricing DHI as if the home-building industry never recovers.
D.R. Horton’s Offerings and Geographic Diversification Lower Risk to Investors
D.R. Horton primarily targets entry-level and move-up buyers, with two-thirds of its home closings priced at $300 thousand or below, per Figure 4. While this focus on more affordable housing does expose DHI to the risk of lessening demand for starter homes if credit conditions tighten in a slowing economy, much of that risk is overstated in today’s environment.
Figure 4: D.R. Horton Revenue Breakdown – TTM Ended 12/31/19
(Click on image to enlarge)
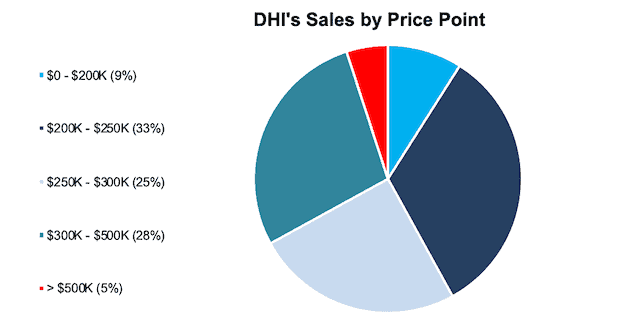
Sources: New Constructs, LLC and company filings
Prior to the pandemic, there was a large unmet demand for affordable housing. DHI recently noted the firm has experienced, “very strong demand from homebuyers, as the entry-level segment of the new homes market remains under-served with low inventory levels relative to demand. Even as the COVID-19 pandemic spread during the month of March, DHI’s March net sales orders increased 6% YoY and its sales order backlog increased 14% YoY. When you look beyond the current dip in economic activity, we think the demand for entry-level homes will remain strong over the long term.
D.R. Horton is also the most geographically diverse and largest-volume builder in the U.S., which limits the geographical risk that threatens many smaller firms. With homebuilding operations in 90 markets across 30 states (compared to 21 states for LEN and 23 states for PHM), DHI is not overly exposed to any single market. This diversification is especially important considering how varied the COVID-19 impact has been across the U.S., and how some locales are already beginning to re-open.
It’s Not 2008 Again
Investors certainly remember the housing market collapse that led to the Great Recession in 2008-2009. While people love to discuss how risky financing practices drove the housing bubble, many seem to forget the second driver of the housing bubble – supply. The market was oversupplied in 2008 and is undersupplied today.
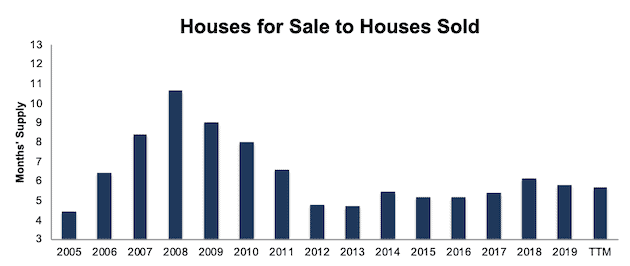
By looking at the ratio of houses for sale to houses sold, we can understand the level of supply in the housing market. Figure 5 shows the current supply in the market is much lower than 2007 and 2008. Over the TTM, the housing supply is nearly half what is was in 2008. Given that the financial practices that led to such an overbuild in the years prior to 2008 are largely obsolete (due to heavy regulation), it should be no surprise to see the market is much more evenly balanced today.
Figure 5: Ratio of Houses for Sale to Houses Sold in the U.S.
(Click on image to enlarge)
Sources: New Constructs, LLC and Federal Reserve Economic Data
While many may associate falling stock prices with falling house prices, it is important to note that an economic recession does not necessarily produce a housing market downturn. Housing is an essential human need that can persist in the good times and the bad.
Well-Positioned to Take More Market Share
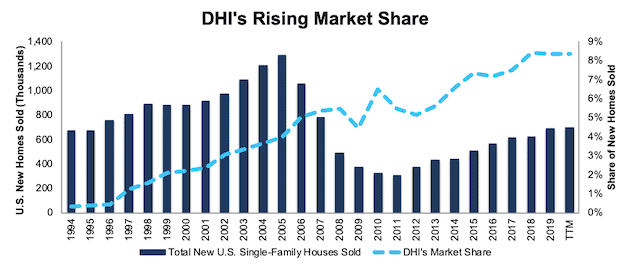
DHI has a proven track record of increasing market share and has more total home closings than any other builder since 1978. Per Figure 6, DHI increased its total houses sold as a percent of U.S. single-family new home sales from less than 1% in 1994 to over 8% in 2019. Over the past two decades, DHI grew its revenue by 9% compounded annually and core earnings by 11% compounded annually. While bad economic conditions may force some builders out of business, DHI is well-positioned, with its liquidity and leading market presence, to once again come through a crisis with an even greater share of the market.
Figure 6: DHI’s Annual Home Closings as a Percentage of U.S. Single-Family New Home Sales
(Click on image to enlarge)
Sources: New Constructs, LLC, company filings, and U.S. Census Bureau
DHI Trades at Cheapest Level in Years
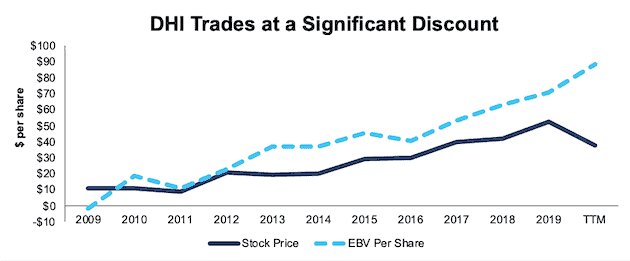
After falling 26% YTD, DHI now trades significantly below its economic book value and at its cheapest level since 2006. At its current price of $41/share, DHI has a price-to-economic book value (PEBV) ratio of 0.5. This ratio means the market expects DHI’s NOPAT to permanently decline by 50%. This expectation seems overly pessimistic over the long term.
DHI’s current economic book value, or no-growth value, is $88/share – a 126% upside to the current price.
Figure 7: DHI’s Stock Price vs. Economic Book Value (EBV)
(Click on image to enlarge)
Sources: New Constructs, LLC, and company filings.
DHI’s Current Price Implies Scenario Worse Than 2008 Housing Crisis
Below, we use our reverse DCF model to quantify the cash flow expectations baked into DHI’s current stock price. Then, we analyze the implied value of the stock based on different assumptions about COVID-19’s impact on the housing industry and DHI’s future growth in cash flows.
Scenario 1: Using the historical revenue declines and margins for the housing crisis from 2007 to 2011, and average historical GDP growth rates, we can model the worst-case scenario already implied by DHI’s current stock price. In this scenario, we assume:
- NOPAT margins fall to 4% from 2020 to 2023 (vs. 10% TTM) – in line with company average from 2007 to 2011 – and increase to 8% (company 10-year average) thereafter
- Revenue falls 25% compounded annually from 2019 to 2023 – equal to the annual revenue decline from 2007 to 2011
- Sales begin growing again in 2024, but only at 3.5% a year, which equals the average global GDP growth rate since 1961
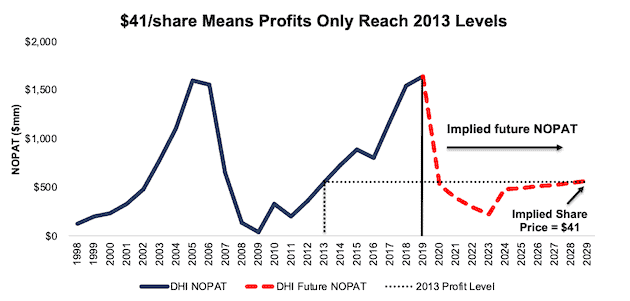
In this scenario, where DHI’s NOPAT declines 68% in 2020 and 10% compounded annually over the next decade, the stock is worth $41/share today – equal to the current stock price. See the math behind this reverse DCF scenario.
For reference, DHI’s NOPAT declined by 26% compounded annually from 2007 to 2011 before growing by 35% compounded annually the next six years.
Figure 8 compares the stock’s implied future NOPAT to the firm’s historical NOPAT in this scenario. This worst-case scenario implies DHI’s NOPAT a decade from now will be 66% below its 2019 NOPAT. In other words, this scenario implies that 10 years after the COVID-19 pandemic, DHI’s profits will have only recovered to around 2013 levels. In any scenario better than this one, DHI holds significant upside potential, as we’ll show below.
Figure 8: Current Valuation Implies Severe, Long-Term Decline in Profits: Scenario 1
(Click on image to enlarge)
Sources: New Constructs, LLC, and company filings.
Scenario 2: Cheap Valuation Provides Significant Upside
If we assume, as does the International Monetary Fund (IMF) and nearly every economist in the world, that the global economy grows strongly in 2021, DHI looks even more undervalued.
In this scenario, we assume:
- NOPAT margins fall to 4% in 2020 (company average during housing crisis) before returning to DHI’s 10-year average NOPAT margin of 8% in 2021
- New home sales fall 15% in 2020, in line with Fannie Mae’s (FNMA) 2020 home sales projection
- Sales growth returns in 2021 at the IMF’s global base-case GDP growth rate of 5.8%
- Sales continue to grow at 3.5% a year, or the average global GDP growth rate sine 1961, each year thereafter
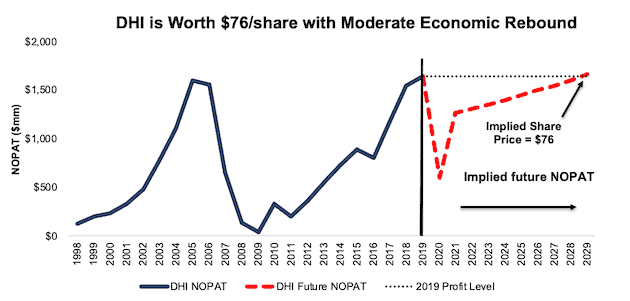
In this scenario, DHI’s NOPAT falls 64% in 2020 and grows by under 1% compounded annually over the next decade, and the stock is worth $76/share today – an 85% upside to the current price. See the math behind this reverse DCF scenario.
For comparison, DHI has grown NOPAT by 18% compounded annually over the past five years and 43% compounded annually over the past decade.
It’s not often investors get the opportunity to buy an industry leader at such a discounted price. There’s upside to $76 as well given that it implies that profits only rebound to just above 2019 levels.
Figure 9 compares the stock’s implied future NOPAT to the firm’s historical NOPAT in scenario 2.
Figure 9: Implied Profits Assuming Global Recovery in 2021: Scenario 2
(Click on image to enlarge)
Sources: New Constructs, LLC, and company filings.
Sustainable Competitive Advantages Will Drive Shareholder Value Creation
Here’s a summary of why we think the moat around DHI’s business will enable it to continue to generate higher NOPAT than the current market valuation implies. The following competitive advantages help DHI survive the downturn, and return to growth as the economy grows again:
- Ample liquidity to survive current downturn
- Diversified presence in 90 U.S. markets in 30 states
- Positioned to take advantage of strong demand for entry-level housing
- Leading profitability among the industry’s top-three revenue leaders
What Noise Traders Miss with DHI
These days, fewer investors focus on finding quality capital allocators with shareholder-friendly corporate governance. Instead, due to the proliferation of noise traders, the focus is on short-term technical trading trends while high-quality fundamental research is overlooked. Here’s a quick summary of what noise traders are missing:
- Consistent core earnings growth over the past decade
- DHI’s ability to grow market-share throughout economic cycles since 1994
- Different supply dynamics of the current housing market vs 2008
- Valuation implies the homebuilding industry never fully recovers from COVID-19
Executive Compensation Plan Could Be Improved
DHI executives are compensated through a three-component plan that includes cash, performance-based restricted stock units (RSUs), and time-based RSUs.
Cash bonuses are awarded based on the level of pre-tax income achieved by the company. Performance-based RSUs are awarded based on meeting four goals measured over a three-year period. These performance goals are relative total shareholder return, relative return on investment, relative selling, general and administrative expense, and relative gross profit.
We would prefer DHI tie performance compensation to improvement in ROIC, as there is a strong correlation between improving ROIC and increasing shareholder value. Tying executive compensation to ROIC also ensures that executives’ interests are properly aligned with shareholders’ interests.
Despite using different metrics, DHI’s plan has not compensated executives while destroying shareholder value. DHI grew economic earnings by 22% compounded annually over the past five years.
Dividend Plus Share Buybacks Offer Nearly 6% Yield
DHI has increased its dividend in each of the past five years. From 2015-2019, DHI increased its dividend by 24% compounded annually. The current annualized dividend of $0.70/share gives DHI a current dividend yield of 1.8%. Even if DHI were to suspend its dividend to conserve cash during the current crisis, we would expect such a suspension to be temporary.
In the past five years, DHI has generated more in free cash flow than it has paid out in dividends. DHI generated a cumulative FCF of $1.5 billion over the past five years and paid out $772 million in dividends over the same time.FCF exceeded dividend payments by an average of $143 million over this time.
In addition to dividends, DHI has returned capital to shareholders through share repurchases. The firm repurchased nearly $480 million worth of shares in 2019 and $624 million (4% of market cap) over the TTM. As of March 31, 2020, DHI is authorized to repurchase an additional $535 million worth of shares. If DHI continues to repurchase shares in line with the TTM period, shareholders can expect a combined total yield of 5.8% from buybacks and dividends.
A Consensus Beat or Signs of Recovery Could Send Shares Higher
According to Zacks, consensus estimates at the end of January pegged DHI’s 2020 EPS at $5.17/share. Jump forward to April 23, and consensus estimates for DHI’s 2020 EPS have fallen to $4.54/share.
While the short-term impact of the COVID-19 pandemic is yet to be seen, these lowered expectations provide a great opportunity for a high-quality business, such as DHI, to beat consensus, if not this quarter, then maybe the next. Though our current Earnings Distortion Score for DHI is “In-Line”, DHI beat EPS estimates in 11 of the past 12 quarters, and doing so again, in the midst of such market turmoil, could send shares higher.
Additionally, the most obvious concern for DHI in the short-term is the impact of social distancing measures on both its building and selling processes. Any positive signs from states that begin to lift restrictions across the country would be welcome news and could send shares higher.
Insider Trading and Short Interest Trends
Over the past twelve, months, insiders have bought a total of 101 thousand shares and sold 828 thousand shares for a net effect of 726 thousand shares sold. These sells represent less than 1% of shares outstanding.
There are currently 7.5 million shares sold short, which equates to 2% of shares outstanding and 1 day to cover. Short interest is up 8% from the prior month.
Critical Details Found in Financial Filings by Our Robo-Analyst Technology
As investors focus more on fundamental research, research automation technology is needed to analyze all the critical financial details in financial filings as shown in the Harvard Business School and MIT Sloan paper, "Core Earnings: New Data and Evidence”.
Below are specifics on the adjustments we make based on Robo-Analyst findings in D.R. Horton’s 2019 10-K:
Income Statement: we made $328 million of adjustments with a net effect of removing $30 million in non-operating expenses (<1% of revenue). See all adjustments made to DHI’s income statement here.
Balance Sheet: we made $5.2 billion of adjustments to calculate invested capital with a net increase of $2.8 billion. One of the most notable adjustments was $3.9 billion (31% of reported net assets) in asset write-downs. See all adjustments to DHI’s balance sheet here.
Valuation: we made $4.2 billion of adjustments with a net effect of decreasing shareholder value by $3.5 billion. Apart from total debt, the most notable adjustment to shareholder value was $276 million in minority interests. This adjustment represents 2% of DHI’s market cap. See all adjustments to DHI’s valuation here.
Attractive Funds That Hold DHI
The following funds receive our Very Attractive rating and allocate significantly to D.R. Horton.
- iShares US Home Construction ETF (ITB) – 14.1% allocation.
- AmericaFirst Seasonal Rotation Fund (STQIX) – 5.9% allocation.
- Invesco Dynamic Building & Construction ETF (PKB) – 5.2% allocation.
- State Street SPDR S&P Homebuilders ETF (XHB) – 4.3% allocation.
- AmericaFirst Monthly Risk-On Risk-Off Fund (ABRWX) – 4.3% allocation.
[1] Our core earnings are a superior measure of profits, as demonstrated in In Core Earnings: New Data & Evidence a paper by professors at Harvard Business School (HBS) & MIT Sloan. The paper empirically shows that our data is superior to “Income Before Special Items” from Compustat, owned by S&P Global (SPGI).
Disclosure: David Trainer, Kyle Guske II, and Matt Shuler receive no compensation to write about any specific stock, style, or theme.


