
Quick Take On The State Of The Market
It's been a hectic weekend and as such, I'm going to keep my subjective analysis of the market brief and let the indicators and market models do most of the talking this morning.
However, since returning from our trip across the pond late last week, I have been asked a few times about my take on the current state of the market. In short, I continue to believe that we have a news-driven environment on our hands with the outlook for the global economy and the trade war being the primary focal points. (Feel free to deposit this statement in the "duh!" category).
To be sure, the action remains volatile as the algos exaggerate moves in both directions. When good news hits the wires, stocks lurch forward and then conversely, when there is bad news, the major indices tend to experience a "whoosh" lower.
But from a longer-term perspective, the end result is, to borrow a phrase, much ado about nothing. Don't look now fans, but stocks have gone nowhere over the past twelve months. And from a shorter-term perspective, the S&P 500 has been moving sideways in a 100-point range between 2850 and 2950.
So for me, one of the key takeaways here is that the majority of the day-to-day machinations should probably be viewed as nothing more than "noise". Well, until the current range breaks, anyway.
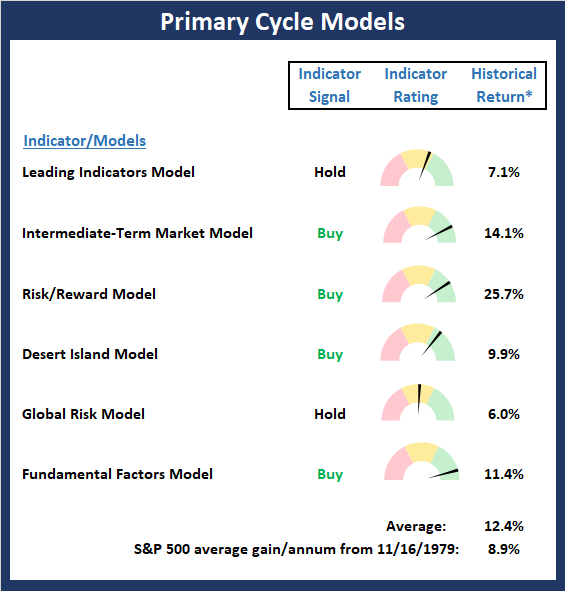
The good news is that from an intermediate- and longer-term perspective, things continue to be in pretty good shape. For example, take a look at both the Primary Cycle and Fundamental boards below. As has been the case for some time now, these two big-picture indicator boards still sport a lot of green.
From a chart perspective, things also look decent when looking at at the market longer term, which, for me, means viewing a weekly chart.
S&P 500 - Weekly
(Click on image to enlarge)
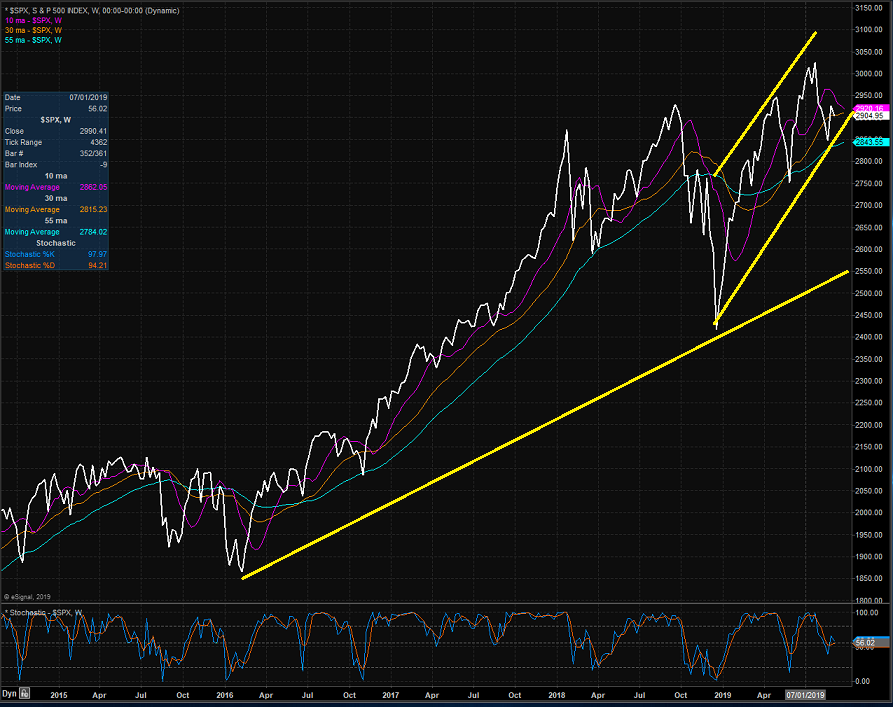
Sure, stocks are in the midst of a corrective phase. No one is going to argue that. And yes, the action has been extremely volatile. But as the chart above illustrates, there are solid uptrends intact from the beginning of the most recent bear market low (early 2016) as well as the December panic low.
So, if you want to keep it simple, you can argue that as long as the S&P 500 doesn't make a "lower low" on the weekly chart, the trend remains bullish.
And for those with a shorter-term view, a meaningful break below the early-June low would turn the technical picture negative. But until then, it is probably best to keep the big-picture in mind, to ride out the volatility and the trading range, and to give the bulls the benefit of the doubt - for now.
Weekly Market Model Review
Now let's turn to the weekly review of my favorite indicators and market models...
The State of My Favorite Big-Picture Market Models
While the market certainly feels a little wobbly lately and the bears continue to make there case that stocks have nowhere to go but down, I will note that none of my favorite big-picture market models are currently on sell signals. This suggests that the weight of the evidence remains positive at this stage. And while things can certainly change, the current market environment continues to be news driven.
This week's mean percentage score of my 6 favorite models rose to 72.2% from 68.9%% last week (Prior readings: 62.8%, 71.1%, 70.3%, 84.1%, 79%, 83.9%) while the median also improved to 75.0% versus 65.0% last week (Prior readings: 63.4%, 70.0%, 68.4%, 86.5%, 80%, 86.7%, 82.5%).
* Source: Ned Davis Research (NDR) as of the date of publication. Historical returns are hypothetical average annual performances calculated by NDR. Past performances do not guarantee future results or profitability - NOT INDIVIDUAL INVESTMENT ADVICE.
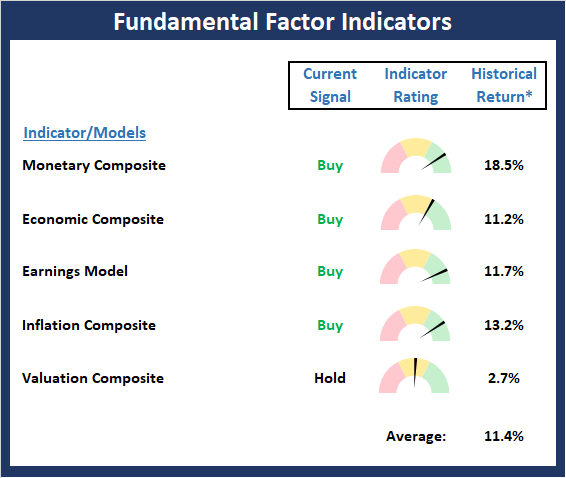
The State of the Fundamental Backdrop
There was no obvious change to the Fundamental Factors board this week. However, I will note that the Monetary, Economic, and Inflation Composite all slide a little. There wasn't enough movement to change the rating or the mode of the models, but I do think it's important to note that these models are weakening - again, just a bit. Yet at the same time, the "relative" Valuation model that incorporates the level of rates continues to improve. As such, the overall movement appears to be a wash and the bulls continue to deserve the benefit of any doubt from a macro perspective.
* Source: Ned Davis Research (NDR) as of the date of publication. Historical returns are hypothetical average annual performances calculated by NDR. Past performances do not guarantee future results or profitability - NOT INDIVIDUAL INVESTMENT ADVICE.
The State of the Trend
Somewhat surprisingly, the Trend board remains in pretty good shape. As such, it is hard to be overly negative on the market here. Looking at the charts, I have written recently that I had been placing less importance on price levels of the major indices. My argument was that news/headlines/tweets were driving the algos and that the algos don't really care about things like trendlines, support/resistance levels, and the like on an intraday basis. However, this week I need to adjust my stance a bit due to the obvious trading range that has developed since early August. As such, a meaningful break above S&P 2940 or 2850 would be meaningful.

* Source: Ned Davis Research (NDR) as of the date of publication. Historical returns are hypothetical average annual performances calculated by NDR. Past performances do not guarantee future results or profitability - NOT INDIVIDUAL INVESTMENT ADVICE.
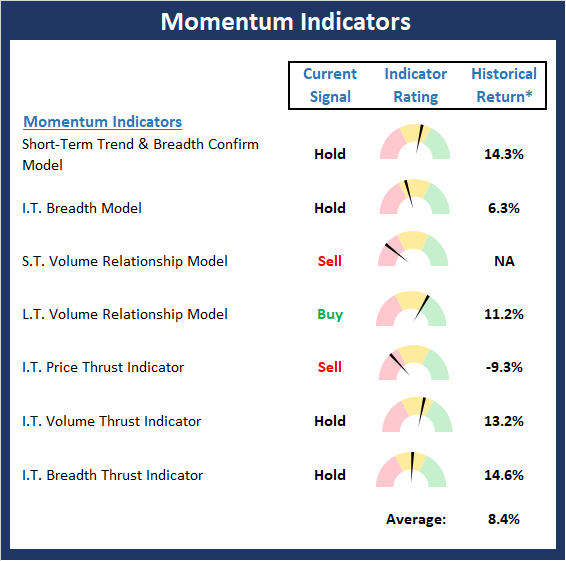
The State of Internal Momentum
As I've been saying the last few weeks, the Momentum board remains a problem for the bullishly inclined. My take has been that the state of this board means that some caution is warranted. The good news that three of the component models improved from negative to neutral this week. And while the current readings are hardly reason for celebration, I'll take the improvements.
* Source: Ned Davis Research (NDR) as of the date of publication. Historical returns are hypothetical average annual performances calculated by NDR. Past performances do not guarantee future results or profitability - NOT INDIVIDUAL INVESTMENT ADVICE.
The State of the "Trade"
As I have said a time or twenty, the best moves in the market tend to occur when the stars are aligned on the Early Warning board. In other words when the table is set up well across all three time frames, the moves can be explosive. However, at this stage of the game, the stars are most definitely not aligned. As such, neither team really has much of an edge here.

* Source: Ned Davis Research (NDR) as of the date of publication. Historical returns are hypothetical average annual performances calculated by NDR. Past performances do not guarantee future results or profitability - NOT INDIVIDUAL INVESTMENT ADVICE.
Disclosure: At the time of publication, Mr. Moenning held long positions in the following securities mentioned: none - Note that positions may change at any time.
The opinions and forecasts ...
more

