
Quants Discover A Guaranteed Source Of Alpha: Just Trade Based On The Growth Of The Fed's Balance Sheet
It was almost nine years ago when - in a world that was becoming increasingly centrally-planned by central banks and disconnected from fundamentals - we first recommended to readers that the simplest way to generate alpha and outperform the broader market was to do the opposite of what Wall Street's professionals were doing, and go long the most hated stocks. This is what we said one year later when reviewing and doubling down on this very strategy:
"...in a world in which nothing has changed from a year ago, and where fundamentals still don't matter, what is one to do to generate an outside market return? Simple: more of the same and punish those who still believe in an efficient, capital-allocating marketplace and keep bidding up the most shorted names."
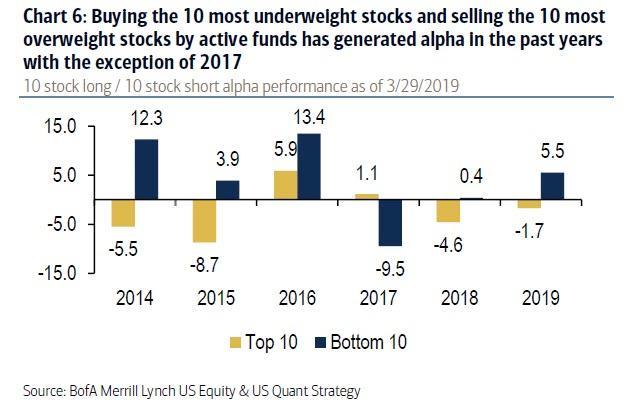
Fast forward to early 2019 when none other than Bank of America confirmed that we were correct: as the bank's chief equity strategist Savita Subramanian wrote last April, "over the last several years, buying the most underweight stocks by large cap active funds and selling the most overweight stocks by large cap active funds has consistently generated alpha."
As the bank added, the 10 most neglected stocks had outperformed the 10 most crowded stocks by an annualized spread of 8.4% on average during the first 15 days of each quarter since 2012. This is shown in the chart below, which reveals that buying the 10 most underweight stocks and selling the 10 most overweight stocks by active funds has generated alpha every year in the past five except 2017.
As we said nearly a decade ago, going long the most shorted names has been a source of incremental alpha for much of the past decade (a time when most hedge funds had abandoned alpha generation altogether, and instead focused on levered beta strategies in hopes of halting the "2 and 20" model).
But what if there is an even simpler strategy to beat the market and generate alpha? According to SocGen (SCGLY) quants including Solomon Tadesse, Andrew Lapthorne, and others, who last week penned a note titled "Can quants make money by tracking the Fed books?" there is, and it involves that other strategy we have been pounding the table on for much of the past decade, namely to trade alongside the Fed's balance sheet which has become the dominant price setter in this upside-down market.
Before we get into the details of the proposed trade, here is some background which we provide for the benefit of those who still claim the Fed does not influence stock prices:
"Monetary policy historically dictates asset price dynamics, with low interest rates and accompanying expansionary monetary policy supporting risk asset rallies and monetary contractions by contrast driving market retreats. This has increasingly been more obvious since the Great Financial Crisis of 2008, where financial market reactions appear to have become increasingly aligned and dependent on central bank actions.
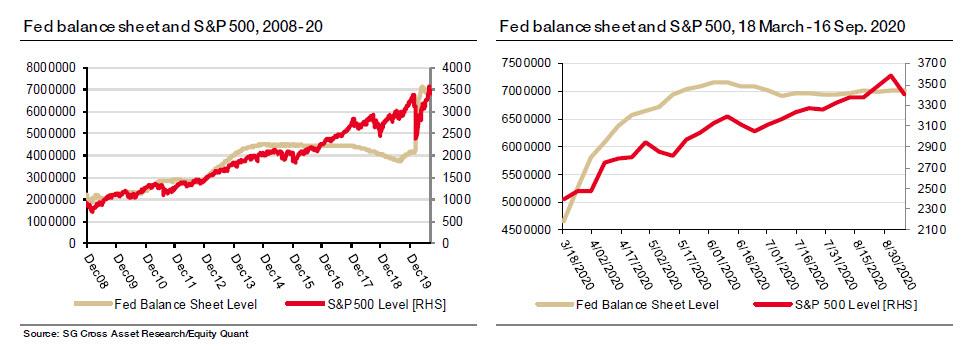
"Indeed, with the advent of QE programs as monetary policy tools in the wake of the 2008 GFC, the trajectories of market performance and the Fed balance sheet appear to have converged into lock step. Total assets on the Fed balance sheet have expanded from $2.24 trillion at the end of 2008 to the current level of about $7 trillion, for 216% growth, while the S&P 500 rose from 903.25 to about 3340, netting cumulative growth of about 270% during the same period.
"Over the course of the current pandemic, the Fed balance sheet has increased from $4.67 trillion on March 18, 2020 (a week before the market bottom) to $7.01 trillion, growing by 50%, while the S&P 500 has risen by 42% during the same period."
"This broad view of the relationship between Fed actions and stock market performance appears to suggest a causal link going from central bank policies to asset prices. The question then is how predictable are asset returns based on prior Fed actions, and whether such predictability can be utilized in enhancing investment performance?"
How predictable, indeed. And has the Fed forcibly made its policies so transparent, yet market-moving, to ensure that everyone can partake in the market "upside"? Before we get into the experimental specifics, here is a summary of the strategy proposed by the SocGen quants - to trade in lockstep with the change in Fed's balance sheet:
- Since the Great Financial Crisis of 2008, financial markets appear to have become increasingly aligned with central bank actions and increasingly less connected to economic fundamentals. So, should you simply follow the Fed? The above observation is now generally expected, and there is a plethora of charts circulating showing the relationship between the size or the growth of the Fed balance sheet and a variety of risk assets. But can we use this information systematically to inform our investment decisions?
- The sheer scale of these unconventional measures does seem to have also made asset returns more predictable, and performance appears increasingly contingent on central bank actions. This provides a potential opportunity for investors.
- And with the Fed committing to maintain its asset purchase programs “at least at the current pace to sustain smooth market functioning," and with ultra-low rates expected to at least until 2023, it is clear these unconventional monetary policies are going to remain a key driver of markets for some time.
To help confused investors, the SocGen note introduces a simple tactical alpha strategy that uses the growth of the Fed balance sheet to measure the degree to which monetary expansion is supporting risk-asset rallies. The strategy, implemented in the context of the classic long-only equity/cash decision, "provides supportive evidence of market predictability and the potential to utilize measures of unconventional monetary policies in designing systematic strategies."
In short, all one needs to outperform the market is to front-run, or even back-run, the Fed's balance sheet growth.
More importantly, "the simulation generates a sizable outperformance with a reasonable success rate," and while illustrative, the strategy provides a framework to extend to analogous risk -on/-off cases involving other asset classes, as well as the design of more complex long/short strategies with leverage.
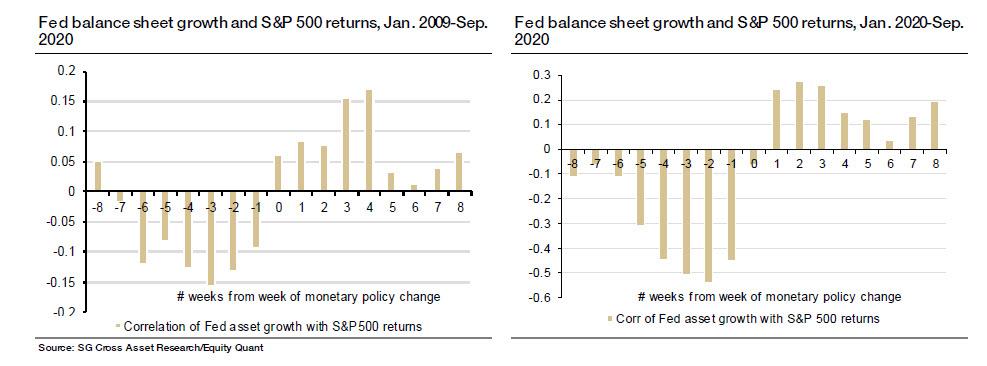
As Lapthorne, Tadesse et al write, to check if these contemporaneous correlations might suggest causality, the figures below present the correlation of weekly growth (log differences) in total Fed balance sheet assets with lagged and subsequent returns of the S&P 500 index.
It shows the correlation between the Fed’s asset expansion/contraction in week t and stock market returns in week t + k, where correlations at negative values of k indicate the Fed’s response to lagged stock returns, and correlations at positive values of k show stock market’s reactions to the Fed’s actions.
"The negative correlation between lagged stock market performance and current growth in Fed assets (left-hand chart) means that stock market declines increase the likelihood of Fed action in the form of balance sheet expansion.
"On the other hand, the positive correlation between subsequent stock market performance and current Fed asset growth means that Fed balance sheet expansion leads to positive stock market performance. The impact of Fed asset growth on equity markets lasts, on average, for the subsequent four weeks."
"Consistent with economic priors, balance sheet expansion leads to stronger positive market returns, and our analysis shows that this lasts for up to four weeks, following the policy change (left figure) with a peak observed at three weeks.
"On the other hand, and contrary to expectations, Fed balance sheet contractions are also followed, on average, by market rebounds, although the strength of these correlations were much weaker in the initial three weeks, with a stronger bounce on the four-week mark."
As the strategists explain, while there appears to be a small announcement effect at week 0, the market reaction appears gradual. This is consistent with the notion that Fed asset purchases primarily impact the stock market through liquidity spill-overs from the other asset classes that are the target of the direct asset purchases (i.e. Treasuries, MBSs, and corporate bonds).
It may also reflect the impact of subsequent equity repricing from lower cost of capital due to the Fed actions.
How to trade these observations? As SocGen's strategists lay it out, the design of investment strategies that utilize Fed actions need to consider the distinctive lead-lag correlations between Fed expansion and Fed contraction.
As a broad illustration, the bank quants design a weekly tactical alpha strategy based on Fed asset growth that aims to boost investment returns by selectively over-weighting riskier assets during Fed monetary expansion regimes. To that end, the quants used weekly Fed balance sheet data over the period of 2009 and September 2020 – a period of intensive use of unconventional monetary policy tools.
The strategy consists of using a classic equity-cash allocation, with the goal of generating excess returns by systematically tilting towards risk opportunistically following expansionary monetary policy. As an illustration, a long-only portfolio with a strategic allocation of 75/25 between equity and cash was constructed, with a 25% risk budget allocated for tactical alpha, but this can easily be adapted to an equity/bond mix or a long/short strategy.
The evidence shows that the impact of Fed asset growth lasts on average for four weeks, with the lead-lag correlation to cumulative S&P returns peaking at around the fourth week. The input to the strategy is the weekly growth rate in the Fed total assets, and the strategy seeks to allocate more to equities (from safe asset holdings) during periods of monetary easing, as reflected in the growth in Fed assets.
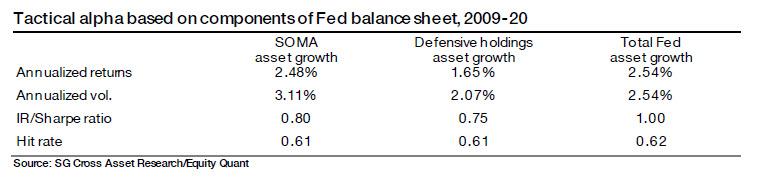
Table 1 below summarizes the performance of this simple tactical tilting strategy. It should come as no surprise to almost anyone, that a systematic tracking of the Fed balance sheet adds value, with the strategy generating annualized excess returns of about 250 bp per annum with a tracking error of similar magnitude, providing a risk-adjusted alpha of one, at hit rate above 60%.
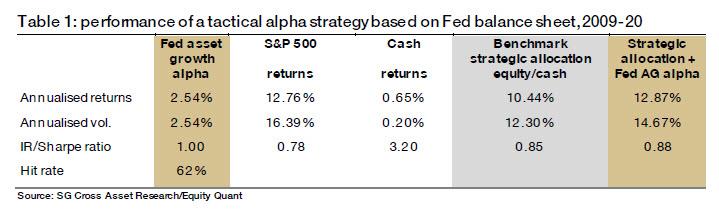
Comparing the performance of the "tactically-boosted" portfolio against the traditional 75/25 benchmark, total returns would have gone up to 12.9% from 10.4%, while the Sharpe ratio improves only modestly, as overall volatility would also pick up.

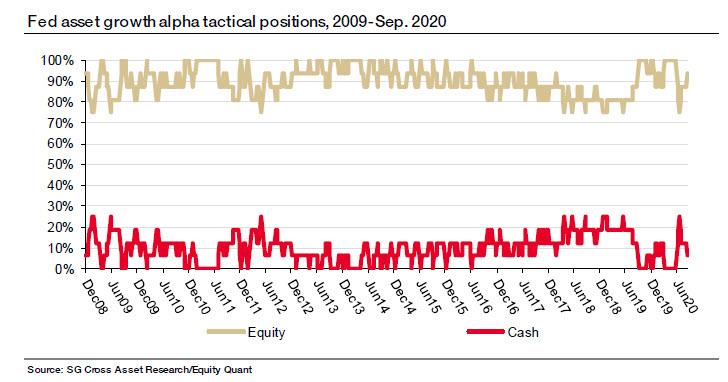
As laid out in the next chart below, the positioning of the strategy shows that the portfolio broadly tracked the monetary policy stance, as reflected in the Fed balance sheet during the period.
During the winding down of QE and quantitative tightening in 2017, 2018, and through half of 2019, the portfolio largely took off its equity bet, staying with its max cash positions, only to get go back to equity starting in the latter part of 2019 as monetary easing began. It was also heavily tilted towards equity in the peak of QE in 2010 through 2014, with periodic shifts to cash during moments of a lull in asset purchases.
To conduct the above analysis, SocGen's quant used the growth in the total assets of the Federal Reserve to design the tactical alpha strategy. A large part of the strategy performance and of market predictability seems to come from the QE-laden SOMA component of the Fed balance sheet (table below), though with higher volatility. There is also evidence that changes in the defensive holdings of the balance sheet (which includes repo and the dollar-swap facilities, which are largely used during crises) may contain some information.
Finally, despite the small size and sporadic nature of the back-stop facilities component, the symbolic role of these programs - which include the Corporate Credit, Main Street, Commercial Paper, Money Market Mutual Fund Liquidity, Municipal Liquidity, Term Asset-Backed Securities, and other facilities that were introduced during the current crisis - to instill market confidence cannot be overemphasized.
Thus, as the quants conclude, "using the overall Fed assets may provide signal diversity across the three pillars, aggregating information on unconventional policies across all domains of Fed activities."
In summary, to generate alpha in the current environment, one can either be a die-hard contrarian and repeatedly go long the most hated/shorted names, or one can pursue an even simpler tactical alpha strategy that uses information on the growth of the Federal balance sheet as a signal of the monetary expansion that generally supports risk-asset rallies.
As SocGen concludes, the strategy implemented in the context of a long-only equity/cash decision provides some evidence of the potential to utilize measures of unconventional monetary policies in designing systematic strategies. The simulation generates a sizable outperformance with a reasonable success rate, which one would naturally expect in a world where trillions in Fed balance sheet expansions lead to record stock market rallies.
That said, unlike the "go long the most hated names" which is a pure alpha trade, the Fed balance sheet-tracking strategy proposed by SocGen is implementable as an overlay through trading on futures or other derivatives, and is meant to add an incremental 2.5% or so to overall returns.
As Lapthorne et al wrap up, "while illustrative, the strategy provides a framework to extend to analogous cases of risk -on/- off cases involving other asset classes, as well as the design of long/short strategies with leverage. Given the multitude of factors that bear on asset performance, the Fed balance sheet signal could also be blended with other factors in multi-factor settings to enhance portfolio performance."
Disclosure: Copyright ©2009-2020 ZeroHedge.com/ABC Media, LTD; All Rights Reserved. Zero Hedge is intended for Mature Audiences. Familiarize yourself with our legal and use policies ...
more


Quite an interesting disclosure in this article. Certainly following the fed as it bulldozes a path for it's friends will be a bit smoother than picking through the jungle. So certainly following can be quite effective, providing that the bulldozer does not drive off of a cliff. (WOW, what a graphic analogy, that!)
There does seem to be a shadow growing, which is that bit of debt that the fed has been creating. The nasty thing about debt is that eventually it must be paid off, or somehow settled. Nothing is free in the long term.