
Proto Labs - An Exciting Growth Story Lagging Behind Expectations
In the following, Proto Labs (PRLB) is analyzed to provide an opinion on whether the stock is currently undervalued. First of all, the market potential and the market size of 3D printing will be discussed. Afterward, a comparison of peer group companies is made. The advantages of PRLB are shown, and it is explained what draws my attention to this stock. Subsequently, the business model of PRLB is briefly described, and financial figures are critically reviewed. Finally, a growth rate of the revenues is calculated and will serve as a foundation for deriving the CFs and, eventually, the DCF analysis.
Additive Manufacturing Market
The 3D printing, or to put it differently, "additive manufacturing" market is considered by various sources to be a high-growth market. However, it is challenging to determine the growth of such markets precisely. Many different factors need to be considered. A closer look at the latest forecasts brings evidence. According to Wohlers Associates (see figure 1) & Verified Market Research, the market size in 2020 is approximately $16bn.
Figure 1: 3D printing market size according to Wohlers Associates
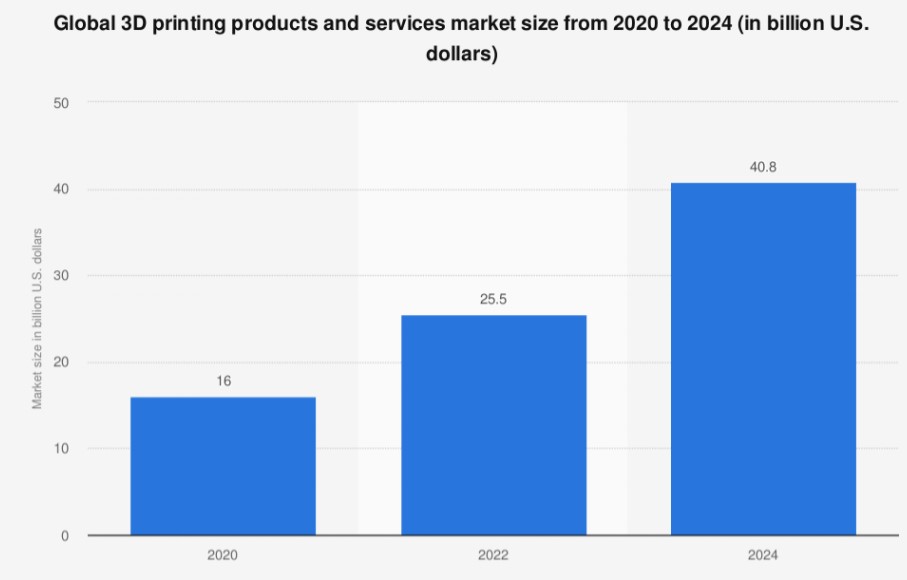
Source: Wohlers Associates
Wohlers expects the 3D printing market to be $40.8bn in 2024 (see figure 1). This represents a CAGR of about 26%. Another forecast was derived by Ernst & Young. They forecast the market to be $27bn in 2023, which results in a CAGR of 19%.
Using a bottom-up approach, ARK Invest determined the most optimistic forecast of $97bn in 2024 (CAGR 57%).
Figure 2: 3D printing market estimations of diverse institutes
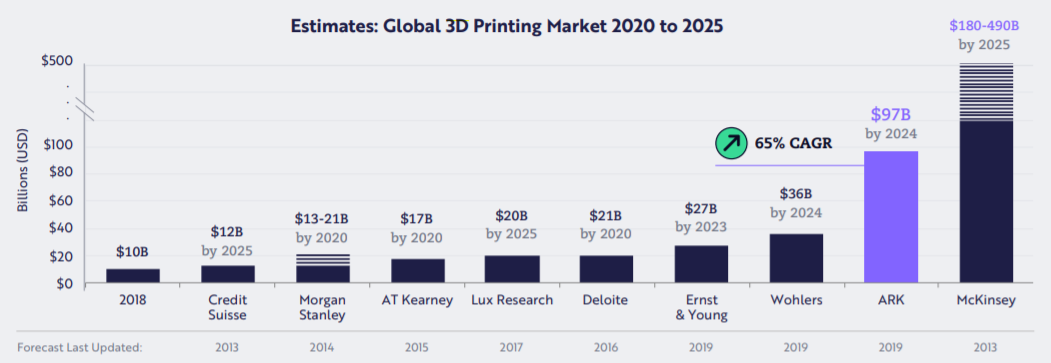
Source: ARK Invest
In 2015, ARK Invest already published a market growth forecast and stated the market would reach $41bn by 2020 (see figure 3). However, this prediction has proven to be very inaccurate, possibly since the adoption of additive manufacturing is taking place more slowly than expected. Thus, only a fraction of the potential demand determined by ARK Invest was realized.
In contrast, the previous forecasts by Wohlers Associates were more precise. Given the substantial difference between the current market size and past assumptions, the uncertainty of the future market size is very high. Nevertheless, research commonly agrees that 3D printing is growing faster than the market as a whole.
Figure 3: Past 3D printing market estimations
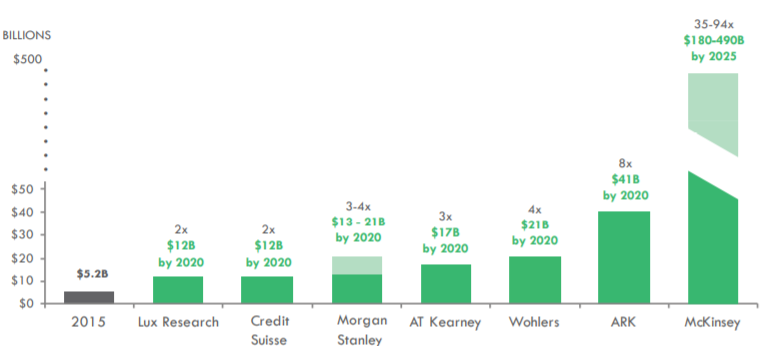
Source: ARK Invest
Comparison of Protolabs with its peers
Companies are active in various areas of 3D printing (see figure 4). Starting with the materials up to the final products. However, firms do not generate the majority of their revenues exclusively through 3D-printing.
Figure 4: Competitive landscape on different 3D printing segment
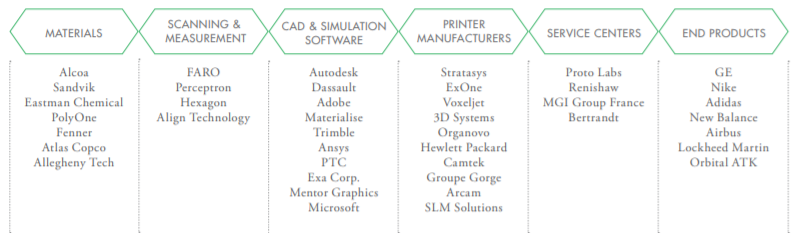
Source: ARK Invest
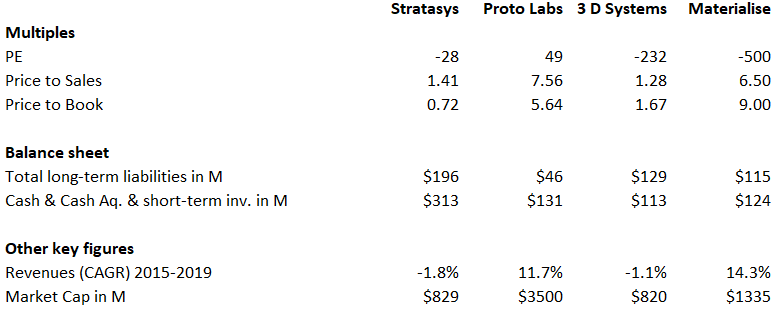
In the following two small-caps & two mid-caps will be compared using multiples and key figures of their respective balance sheets (see figure 5).
Materialise (MTLS), Stratasys (SSYS), and 3D Systems (DDD) are not profitable. Therefore, the TTM pe-ratio is negative. While MTLS showed small profits in 2018 & 2019, DDD has only recorded losses since 2015. SSYS similarly has not been profitable since 2012.
None of the companies meet the ambitious growth targets set by Wohlers Associates & Ark Invest. The sales of SSYS & DDD were even declining from 2015 to 2019. Regardless, SSYS might be worth further research because it is comparatively cheaply priced. It is traded at 72% of the book value and has a clean balance sheet, just like the other three companies. Hence, the existing cash position is sufficient to cover long-term liabilities. However, the negative sales growth and the fact that the company is no longer profitable since 2012, makes this investment rather uninteresting for me at first sight.
Therefore, I chose PRLB. As the company has been profitable since 2007, and Protolabs' sales have grown by 11.7% annually between 2015 & 2019. Due to this, PRLB's multiples are relatively high. This already indicates an overvaluation.
Figure 5: Multiples of different 3D printing companie
Source: created by author
Protolabs
PRLB can produce prototypes within 24 hours and is mainly active in the B2B business. It uses additive manufacturing (3D printing), reductive manufacturing (CNC machining and sheet metal fab), and transformative manufacturing (Injection molding). With the help of PRLB's software, customers can calculate the production costs of the prototype within minutes and have it produced rapidly.
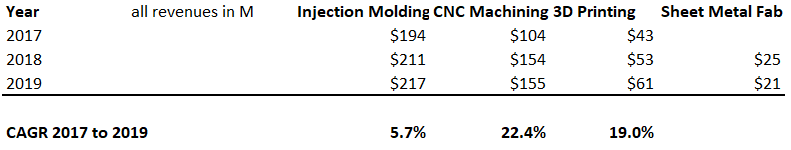
PRLB is, therefore, not a pure 3D printing play, as the revenues can be divided into four streams (see figure 6). Injection molding accounted for 48% of total revenues in 2019, followed by CNC machining with 34%, 3D printing with 13%, and Sheet metal fab with only 5%.
The most significant chunk of PRLB's growth is mainly generated by CNC machining. However, as 3D printing only accounts for 13% of total revenues, this revenue stream will not have a substantial impact on total revenues for the time being. PRLB's sales are, therefore, relatively well-diversified. The same is valid for the customer base. During the last six months, PRLB has supplied to 29703 engineers & product developers, who are mainly active in healthcare, computer electronics, industrial machinery, aerospace, and the automotive sector. The development of revenue is positive, but far behind the market forecasts, as 3D printing has only grown with a CAGR of 19% from 2017 to 2019.
Figure 6: Revenue streams of PRLB from 2017 to 2019
Source: created by author
In addition to the disappointing sales growth, the development of the operating margin must also be regarded negatively. It almost halved between 2014 and 2020. However, not solely the margin is falling but also the total operating income. Hence, the long-term trend of the operating margin represents a red flag.
Figure 7: Revenue, operating income & operating margin of PRLB
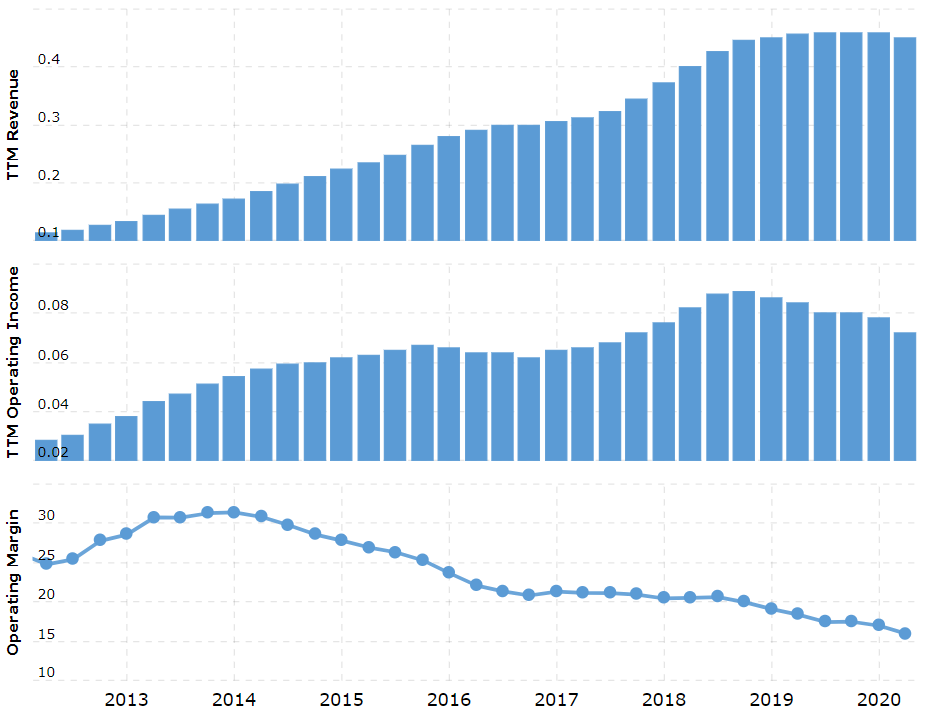
Source: Macrotrends
Future Growth
To calculate the approximate revenue for the upcoming years, an ARIMA model was used. I have applied three different approaches to determine revenues. The first two approaches are rather conservative in opposite to the third one.
1. Approach – ARIMA on past revenue
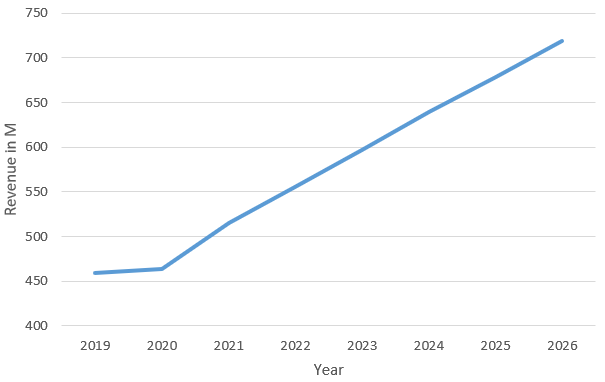
For the first approach, I collected quarterly revenues from 2010 Q1 to 2020 Q1. I excluded 2020 Q2 from the sample because it is an outlier due to Covid-19. The first 32 quarters represent the estimation sample and the last nine the hold-out sample. Consequently, I determined the optimal ARIMA model for the sample and used it to forecast the revenues until 2026. With this method, the CAGR from 2020 to 2026 is approximately 6,6%.
Figure 8: Approach 1
Source: created by author
Figure 9: Quarterly revenue of PRLB in M (created in R)
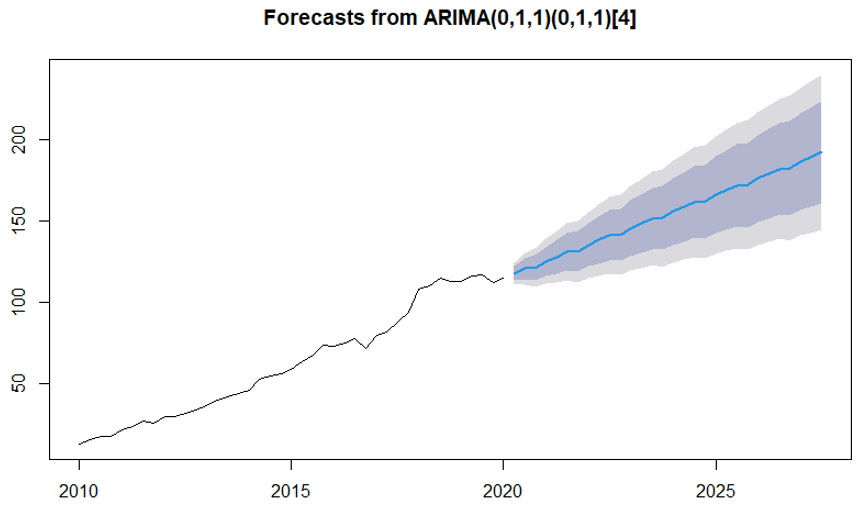
Source: created by author
2. Approach – ARIMA on past revenue streams
By using the ARIMA model on the different revenue streams, more detailed growth rates are made available. The procedure is very similar to the first approach, but this time the forecasts from 2021 to 2026 are prepared separately for the individual revenue streams and finally are summed up. The 2020 revenue is derived from the already published first two quarters (Q1 = $115M, Q2 = $107M), the midpoint guidance (Q3 = $104M), and the forecasts of each revenue stream for 2020 Q4 ($131M). All these components add up to yearly revenue of $457M for 2020.
Figure 10: Approach 2
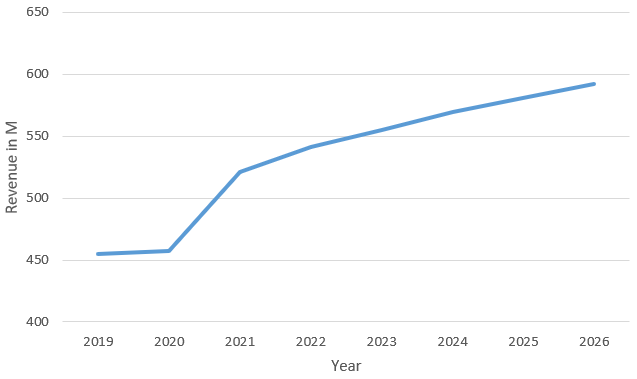
Source: created by author
3. Approach - ARIMA on revenue streams & ARK Invest growths for 3D printing
This approach builds on the second approach, but the 3D printing sales were calculated with the CAGR derived by ARK Invest for the 3D printing market. This approach leads to a CAGR of 21% from 2020 to 2026. When looking at the past growth rates of 3D printing, this approach might be overly optimistic.
Figure 11: Approach 3
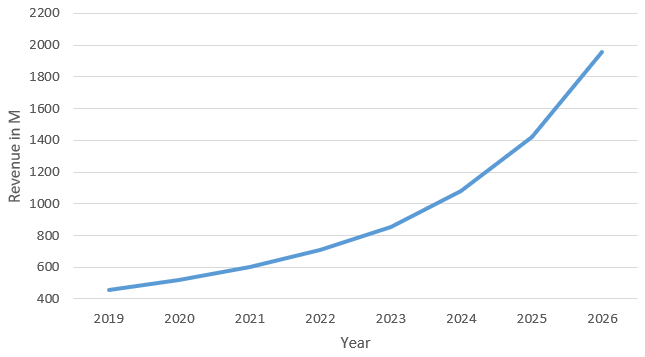
Source: created by author
2020 Q2 Earnings
Protolabs reported earnings of $0.47 (Non-GAAP) per share and $106.6 million in revenue before the market opening on July 28th. The drop in revenue represents a decrease of 8.1% YoY. Despite beating analysts EPS estimates by $0,22 (Non-GAAP) and revenue estimates by $6.12M, the stock fell by 9.6%. This was due to the low guidance of $98M to $110M in revenue for 2020 Q3. The mid-point guidance is, therefore, $104M, which would represent a decline of roughly 11% in comparison to the sales of $117M for 2019 Q3. Another major negative was the drop in the operating margin below 16%. A positive is the balance sheet, which looks still very healthy at $131M in cash on hand and only $46M in long-term liabilities. Additionally, the stock price increased by roughly 109% to $134.89 on July 27th from its March 20th low of $64.61. PRLB was priced to perfection and hence could not fulfill the expectations.
Discounted Cashflow Analysis
While I start my stock analysis by looking at pricing strategies (multiples), I do a discounted cash flow analysis to look at the stock from a different perspective. If both methods indicate an undervaluation, I will add the stock to my portfolio. I chose a high-growth period of six and a half years and applied the growth rates derived by approach number one.
Figure 12: DCF analysis - High-growth phase
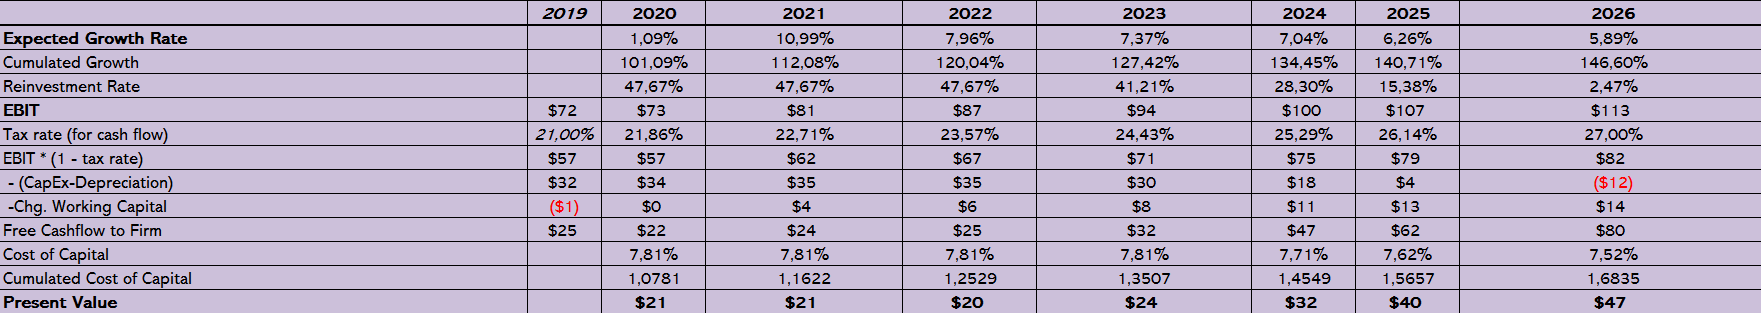
Source: created by author
I adjusted the cost of debt slowly to the industry average and the effective tax rate to the marginal tax rate.
Because there are different methods to determine beta and the market premium, I will explain how I came up with a cost of equity of 8.33% during the high-growth period of PRLB.
![]()
rf = 0.55% 10 year treasury bill rate (as of 08/05/2020)
rm = 5.68% implied market premium (I used buybacks + dividends as cashflows)
β = 1.52 transformed unlevered peer-group beta by PRLB's market value of equity and debt
Figure 13: DCF analysis - Terminal value
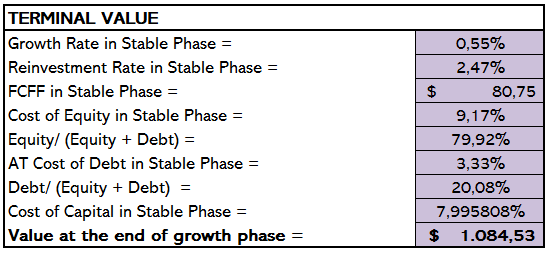
Source: created by author
Thereafter, I calculated the terminal value. I set the risk-free rate as growth rate. The debt to equity ratio is equal to the industry average. Over time PRLBs' ratios will approach the industry averages. Hence, I used the beta and cost of debt of the peer group.
Figure 14: DCF analysis – Calculation of value per share
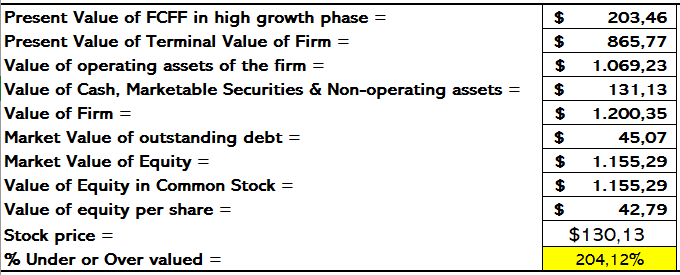
Source: created by author
Lastly, I discounted the terminal value and added it to the present value of the FCFF in the high growth phase. By subtracting the market value of outstanding debt, which are mostly operating leases, I get the fair market value of equity. Divided by outstanding shares, the value of equity is $42.79 per share. That implies the stock is overvalued by 204%.
I repeated the described DCF-analysis for all three approaches:
Figure 14: Comparison of different approaches
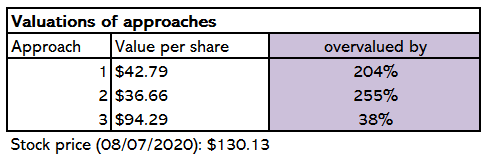
Source: created by author
Conclusion
At the beginning of the analysis, I was biased towards buying PRLB, and I was hoping for my analysis to prove PRLB to be a good investment. Primarily due to the balance sheet and the overall growth trend in the 3D printing market, I was excited about PRLB. However, all three approaches lead to substantial overvaluation. When using higher growth-rates or a higher operating margin, you might end up with an undervaluation. Nevertheless, the previous optimistic estimations on the growth of the 3D were highly inaccurate. Hence, an undervaluation is objectively unjustifiable. Due to these facts, I will not build up a position in PRLB.


Wasn't familiar with $PRLB. Sounds like a good pick.