Profitability, Liquidity, And Investability: The Key Drivers Of Long-Term Outperformance Of S&P SmallCap 600 Versus Russell 2000
The S&P 600TM has outperformed the Russell 2000 since its launch in 1994. From Dec. 31, 1994, to Aug. 30, 2020, the S&P SmallCap 600 had an annualized return of 11.77% (with an annualized volatility of 18.96%) versus the Russell 2000s annualized return of 10.49% (with an annualized volatility of 19.70%).
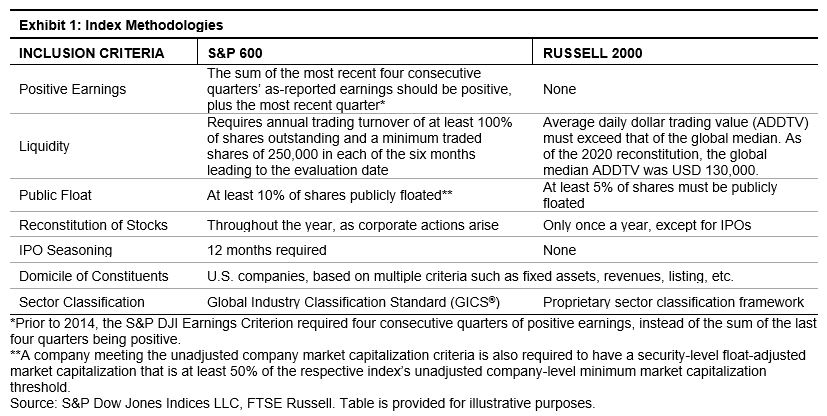
The historical performance divergence is due to differences in index construction, as shown in Exhibit 1. Notably, the inclusion criteria of positive earnings, liquidity, and public float result in the constituents of the S&P SmallCap 6001 being more profitable, more liquid, and more investable than those of the Russell 2000. In this blog, we explore the validity of profitability, liquidity, and investability screening in index construction.
(Click on image to enlarge)

To attest the overall impacts of profitability, liquidity, and investability, we compare the returns of two hypothetical portfolios constructed by dividing the Russell 2000 (R2000)2 universe:
Group 1: Consists of securities that satisfy criteria of profitability, liquidity, and investability as defined for the S&P SmallCap 600.
Group 2: Consists of securities that are not included in Group 1.
For each group, we form equal-weighted and cap-weighted portfolios. Similarly, we also weight the universe equally and by market cap. To show the robustness of our findings, we present the results of the equal-weighted and cap-weighted portfolios. The portfolios are rebalanced monthly.
Equal-Weight Results
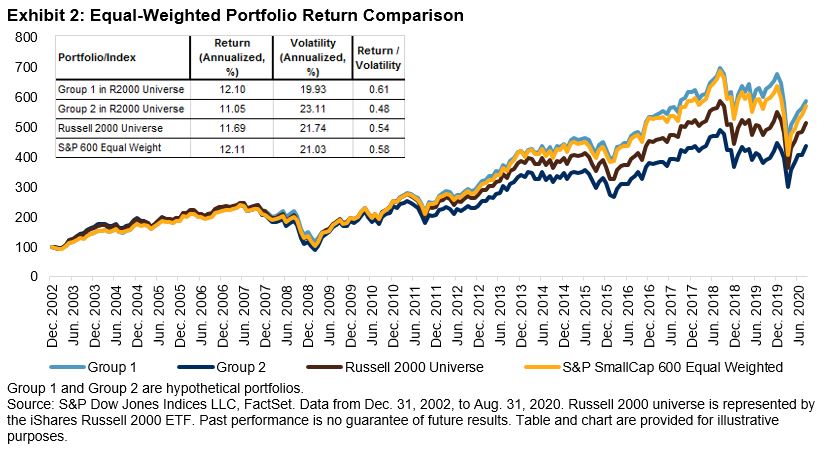
During the period studied, about 700 companies in the Russell 2000 universe would have been in Group 1 and about 1,300 companies in Group 2. Exhibit 2 shows that Group 1 outperformed both Group 2 and the Russell 2000 universe in terms of total return and risk-adjusted return. Such findings indicate that more profitable, liquid, and investable companies tend to outperform their peers in the Russell 2000 universe.
Another important finding is that S&P SmallCap 600 Equal Weighted Index had similar returns to Group1 and naturally outperformed the equal-weighted Russell 2000 universe. The S&P SmallCap 600 Equal Weighted Index achieved its outperformance by using the inclusion criteria of profitability, liquidity, and investability and using only 600 stocks versus 2,000 stocks in the Russell 2000.
(Click on image to enlarge)

Cap-Weighted Results
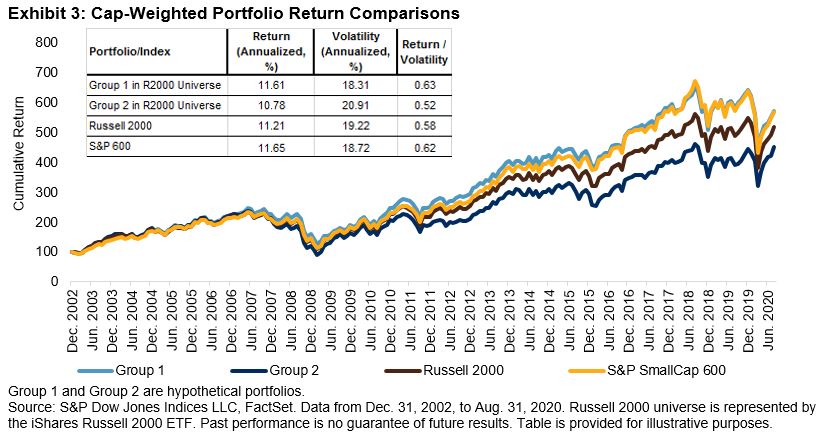
Exhibit 3 shows that the cap-weighted portfolio of profitable, liquid and investable small-cap securities outperformed the portfolio of other members in the Russell 2000 universe and the underlying Russell 2000 benchmark. Once again, the S&P SmallCap 600 had practically the same returns as Group 1 in the Russell 2000 universe and outperformed the Russell 2000.
(Click on image to enlarge)

All else equal, the outperformance in the small-cap space came from companies that are profitable, liquid, and investable (Group 1), as captured by the S&P SmallCap 600. Composed of a fraction of stocks in the small-cap universe, the S&P SmallCap 600 could be easier to implement. In sum, the S&P SmallCap 600 is the model benchmark in the small-cap space.
1 For more detailed index methodology information, please refer to Brzenk, P., W. Hao, and A. Soe. “A Tale of Two Small-Cap Benchmarks: 10 Years Later.” S&P Dow Jones Indices. 2019.
2 We use the holdings of iShares Russell 2000 ETF (ticker: IWM) as a proxy for the Russell 2000 universe. Our testing period ran from December 2002 to December 2018 due to the quality of IWM holding data improving after December 2002.
Disclaimer: Copyright © 2020 S&P Dow Jones Indices LLC, a division of S&P Global. All rights reserved. This material is reproduced with the prior written consent of S&P DJI. For more ...
more


