
Positive Sentiment Surge
With the S&P 500 fighting to retake the 3000 level this week, bullish sentiment has rebounded after dropping to the lowest level since May of 2016 last week. AAII’s percentage of bullish investors rose from 20.31% last week to 33.62%. This brings the sentiment level back within its normal range of the past few years although it is still below the historical average of 38.08%.
(Click on image to enlarge)

This 13.31 percentage point increase was the largest since July 12th of last year when bullish sentiment rose 15.2 percentage points. This week was also the only time since then (66 weeks) that bullish sentiment has even risen by double digits in a single week. While there is plenty of precedence for weeks where bullish sentiment jumped 10 percentage points or more (163 past occurrences since the beginning of the survey in 1987), there has been only one other time that it happened without having done so for at least one year. That was in March of 2013 when bullish sentiment rose 14.36 percentage points, snapping a 116 week-long streak.
Granted it’s just one week, but the S&P 500 performance following that period was generally positive. The next week saw a decline of over 1%, but over the next month, 3 months, 6 months, and year the S&P 500 saw stronger than average returns. On the contrary, average S&P 500 performance following all 163 weeks with increases of 10 percentage points or more has not been as strong as it has actually led to underperformance for all time periods other than one week later.
(Click on image to enlarge)

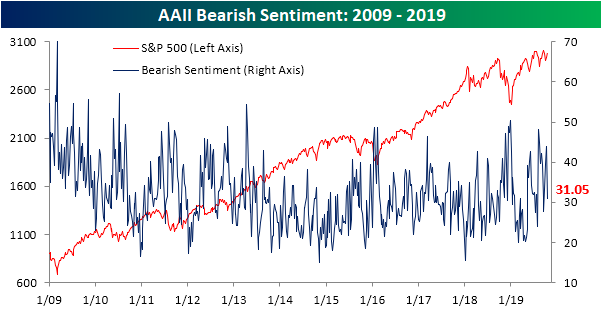
Given the sharp rise in bullish sentiment, bearish sentiment took a nosedive falling to 31.05% from 43.96% last week.While still slightly above the historical average, this drop brought it back down to Earth from its elevated levels.As with bullish sentiment, these sorts of large moves in a single week have not been a common occurrence; perhaps even more so for bearish sentiment.Since the beginning of the survey, there have been 141 weeks including the current week, or 8% of all weeks, where bearish sentiment has seen a double-digit percentage drop. This week’s 12.91 percentage point decline was the largest decline since the 13.4 percentage point move in the second week of this year in the wake of the 2018 sell-off.So unlike bullish sentiment, it has not been quite as long since we last have seen a similar decline but overall there have been fewer weeks with such a decline.
(Click on image to enlarge)
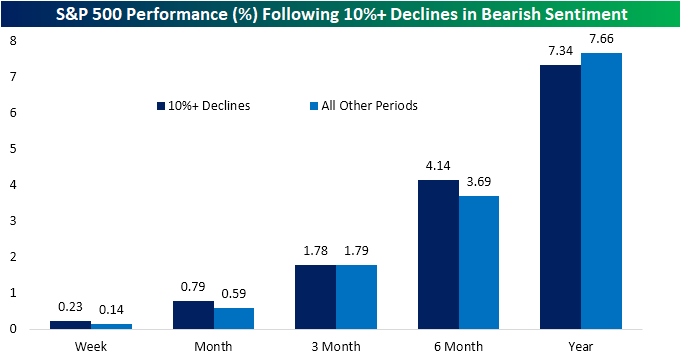
In terms of the S&P 500’s performance following similar declines, the average performance in the following months has been much more in line with the average for all other periods.There has been slight outperformance in the week, month, and 6-month time frames, but slight underperformance 3 months and one year later as shown in the chart below.
(Click on image to enlarge)
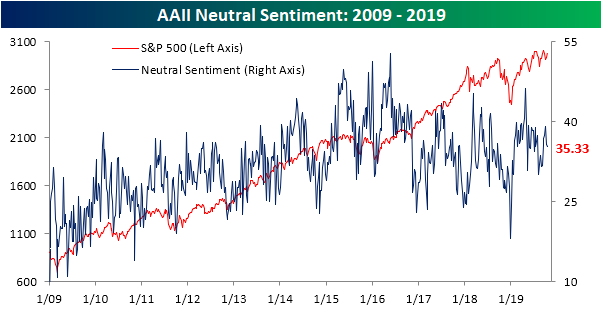
While most of the gain in bullish sentiment came from bears, a small portion also came from those formerly reporting as neutral.The reading on neutral sentiment fell 0.4 percentage points to 35.33% this week.Neutral sentiment is now off of its high from the start of October, but it also remains above its historical average of 31.54%.
(Click on image to enlarge)
Start a two-week free trial to Bespoke Institutional to access our interactive economic indicators monitor and much ...
more

