
Positioning For A Broader Rally

Tobias Levkovich, Citigroup’s chief U.S. equity strategist, was cited late last year with a year-end 2021 S&P 500 price target of 3800. At the time, that made for a 2% price return on the Index—it sits at about 3950 as of today.
Contrary to what this headline S&P 500 price target might imply, Levkovich’s outlook for the economy and for stocks broadly was not dire. But the concentration of the S&P 500 in a handful of names—which powered its strong returns in 2020—would be a drag on the Index in a broader rally of smaller stocks:
“(I)t’s easier to pull a dog sled with Huskies than with Chihuahuas. The megacap tech companies are the Huskies, but that’s not where the real improvement in trend will be. It will be in the smaller, cyclical Chihuahuas. They’ll just have a harder time pulling the S&P 500 dog sled."1
To get a sense of the concentration in the Index, below is a chart on the Herfindahl-Hirschman Index (HHI) for the market cap-weighted S&P 500 relative to its equal-weighted version.
The HHI indicates that the S&P 500 Index is far more concentrated today than at any time over the past 30 years. Its equal-weight version—where each stock receives a 20-basis-point weight at quarterly rebalance—by design has roughly the same level of diversification at all times.
Herfindahl-Hirschman Index
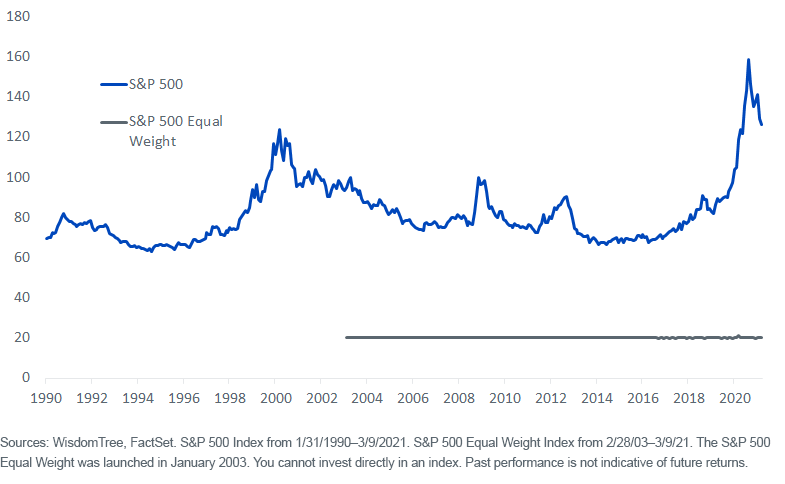
The market cap-weighted Index has been on a historic run of late. The S&P 500 has beaten its equal-weighted version each of the past four years.
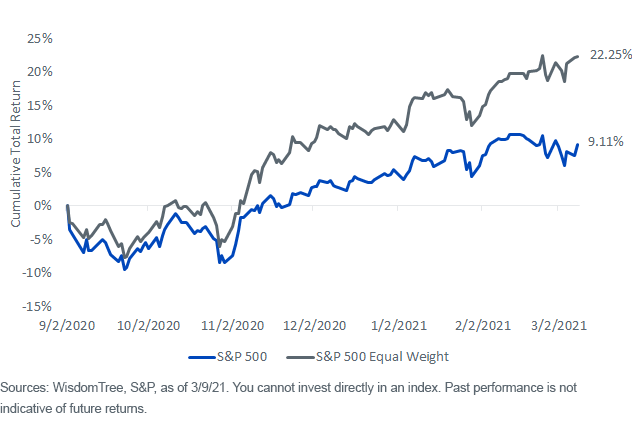
But perhaps for the first time since 2016, there seems to be momentum building for the equal-weighted Index.
Returns Since September 2, 2020
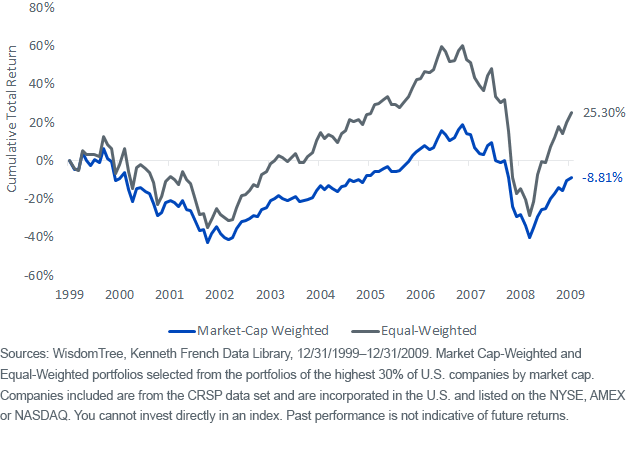
And for those who think this outperformance will merely run out of steam, recall what happened 20 years ago, in March 2000, when the HHI on the S&P 500 previously peaked at 124.
Using portfolios of market cap-weighted and equal-weighted mid- and large-caps (since the S&P 500 Equal Weight was only launched in January 2003 and can’t be used for comparison here), the equal-weighted portfolio was up more than 25% for the decade, while the cap-weighted Index lost more than 8%.
2021: The Year of the Chihuahuas?
As 2020 reminded everyone, the economy’s performance doesn’t dictate the S&P 500’s performance. With likely far better economic conditions in 2021, that could mean a more muted outlook for the headline Index, and better returns for smaller, more economically sensitive stocks (the Chihuahuas).
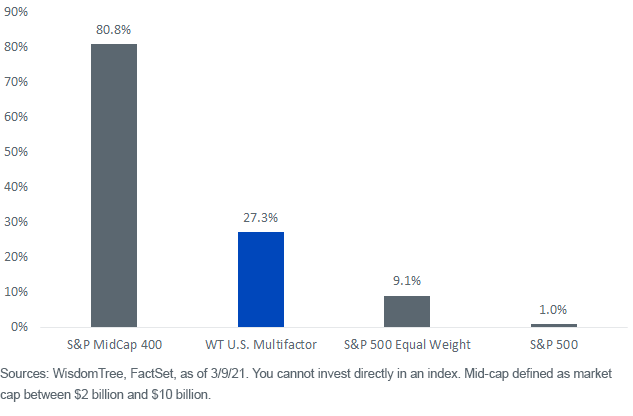
WisdomTree’s U.S. Multifactor Index (WTUSMF) was designed to tap into the diversification elements of equal weighting, while also aiming to mitigate the increased volatility and sector bets that can arise from a simple equal-weighted strategy. As a byproduct of its modified equal weighting, it allocates nearly one-third of its weight to mid-caps.
Percent Index Weight in Mid-Caps
Through the early weeks of 2021, WTUSMF is outpacing the S&P 500 by more than 150 basis points.2 If 2021 shapes up to be a turning point for a broader equity rally than one we have seen in recent years, watch out for greater outperformance from indexes less heavily reliant on outperformance from select mega caps.
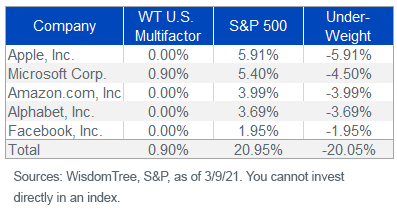
Top 5 S&P 500 Index Weights
1Nicholas Jasinski, “The Stock Market Could Gain Another 10% Next Year, Experts Say,” Barron’s, 12/18/20.
2Sources: WisdomTree, S&P, 12/31/19–3/9/21.
Disclaimer: Investors should carefully consider the investment objectives, risks, charges and expenses of the Funds before investing. U.S. investors only: To obtain a prospectus containing this ...
more

