
Below is a chart of the Russell 2000 cash index. I’ve tinted the area which has represented the vast majority of trading over a full two years. You will note that the Fibonacci Retracements are anchored to the lifetime high, at the top, and the Covid crash low, at the bottom.
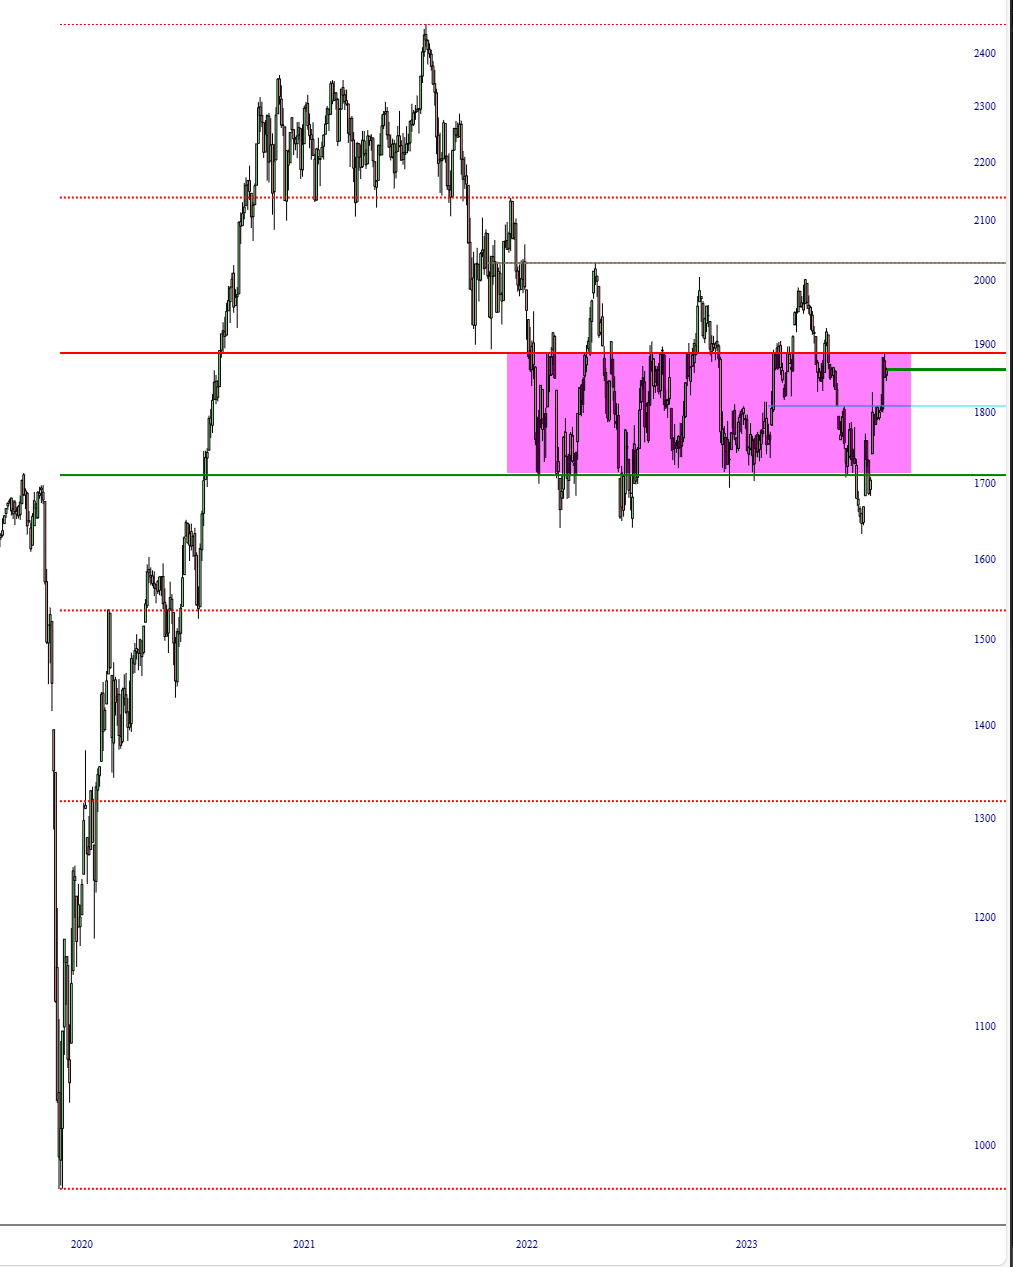
What is remarkable about this is what happened to the RUT just yesterday, on Wednesday. At the highest point, achieved early in the morning, the price came within just a few hundredths of a single point of the retracement level.
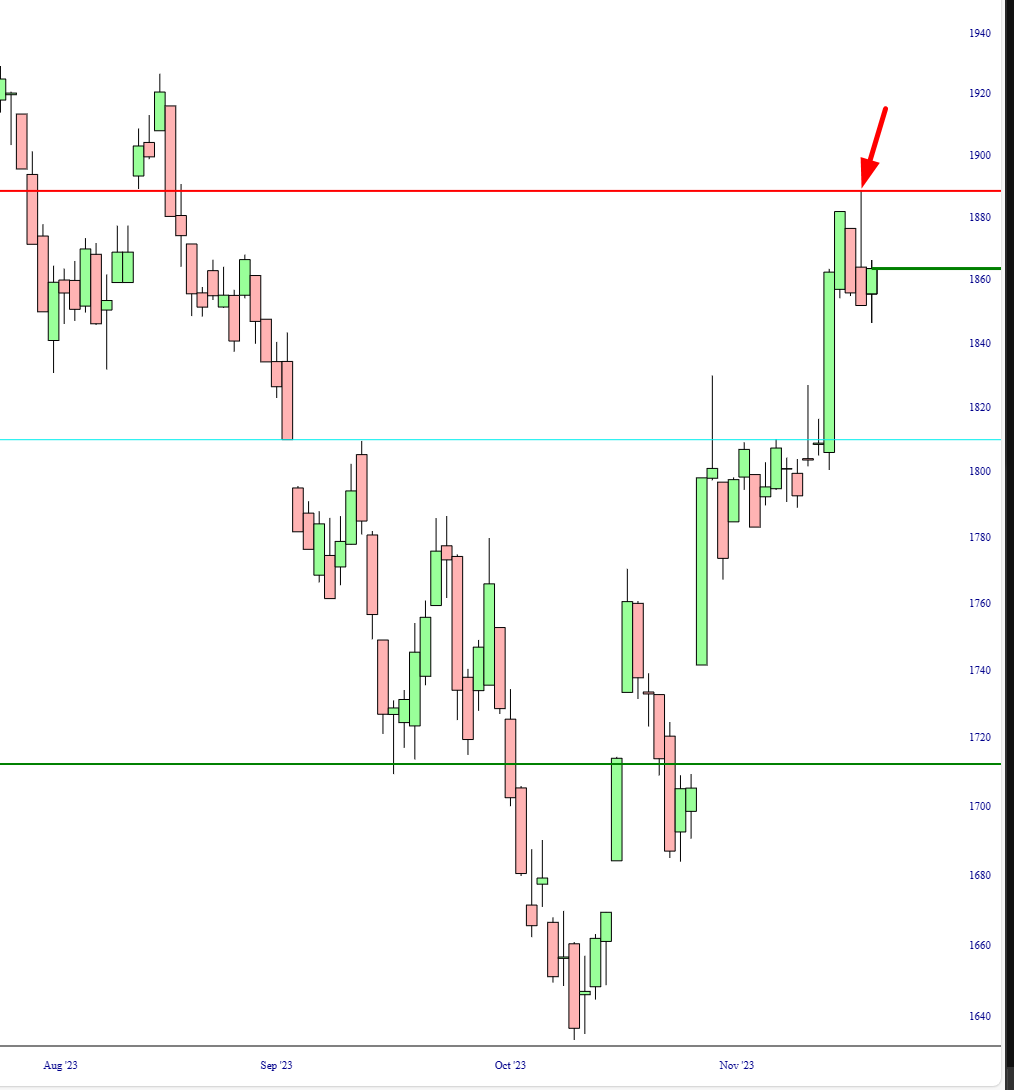
Of course, just one good-sized “up” day could violate this, but it hasn’t happened yet. I’ll be keeping a close eye on this resistance level to see if it holds after the monster rally we’ve endured.
More By This Author:
Pictures Of Lilly
Bearish Signals: Wrapping Up The Day With Chart Analysis
Bullish Signs For Precious Metals Miners, But Crypto Correlation Looms


Comments
Log in or sign up to join the conversation.