
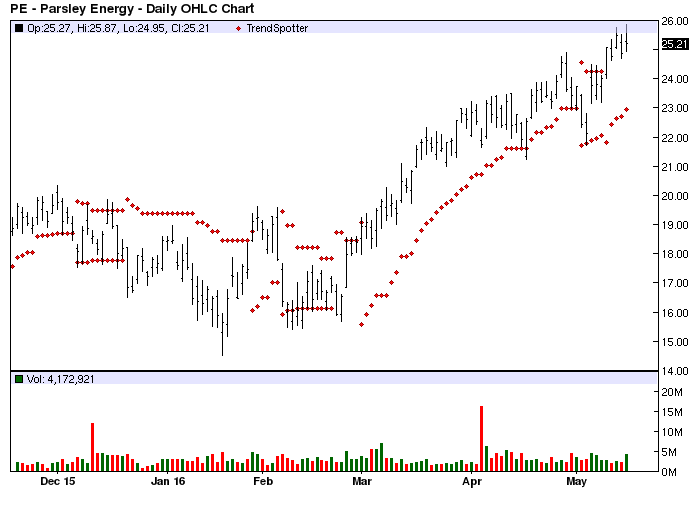
Parsley Energy - Chart Of The Day
The Chart of the Day belongs to Parsley Energy (NYSE:PE). I found the oil exploration stock by using Barchart to sort today's All Time High list first for the most frequent new highs in the last month, ten again for technical buy signals of 80% or more. Next I used the Flipchart feature to review the charts for consistency.
Parsley Energy, Inc. is an independent oil and natural gas company. It is focused on the acquisition, development, and exploitation of unconventional oil and natural gas reserves in the Permian Basin. Parsley Energy, Inc. is headquartered in Midland, Texas.
The status of Barchart's Opinion trading systems are listed below. Please note that the Barchart Opinion indicators are updated live during the session every 10 minutes and can therefore change during the day as the market fluctuates. The indicator numbers shown below therefore may not match what you see live on the Barchart.com web site when you read this report.
Barchart technical indicators:
- 96% technical buy signals
- Trend Spotter buy signal
- Above its 20, 50 and 100 day moving averages
- 12 new highs and up 14.96% in the last month
- Relative Strength Index 61.32%
- Technical support level at 24.42
- Recently traded at 25.21 with a 50 day moving average of 22.61
Fundamental factors:
- Market Cap $3.97 billion
- Revenue expected to grow 56.80% this year and another 53.70% next year
- Earnings estimated to increase 55.60% this year, an additional 375.00% next year and continue to compound at an annual rate of 40.00% for the next 5 years
- Wall Street analysts issued 13 strong buy, 2 buy and 2 hold recommendations on the stock
Disclosure: None.


