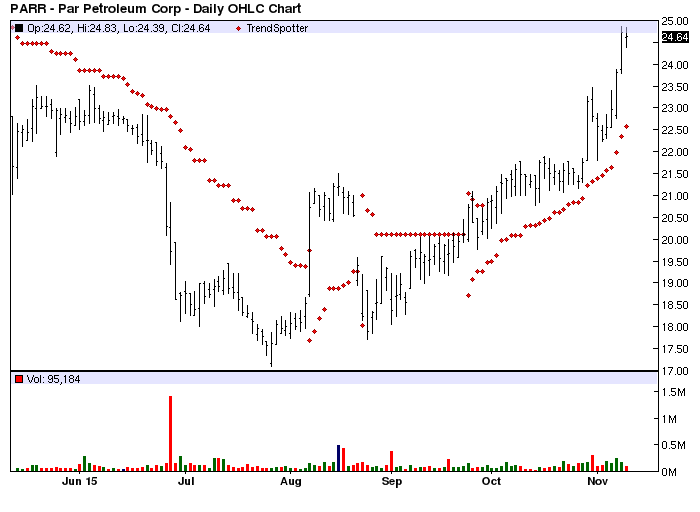
Parr Petroleum - Chart Of The Day
The Chart of the Day belongs to Parr Petroleum (OTCQB:PARR). I found the diversified energy stock by using Barchart to sort the Russell 3000 Index stocks first for a Weighted Alpha of 50.00+ or more, then for technical buy signals of 80% or better , then again for a 50-100 Day MACD Oscillator buy signal. Last I use the Flipchart feature to review the charts. Since the Trend Spotter signaled a buy in 9/24 the stock gained 18.87%.
Par Petroleum Corporation operates as a diversified energy company. It operates in three segments: Refining, Distribution, and Marketing; Natural Gas and Oil Operations; and Commodity Marketing and Logistics Operations. The Refining, Distribution, and Marketing segment owns and operates a refinery that produces sulphur diesel, gasoline, jet fuel, marine fuel, and other associated refined products. The Natural Gas and Oil Operations segment owns and operates natural gas reserves located in the Piceance Basin of Colorado. The Commodity Marketing and Logistics segment focuses on sourcing, transporting, marketing, and distributing crude oil from Canada and the Western United States to refining hubs in the Midwest, Gulf Coast, and East Coast regions of the United States. Par Petroleum Corporation is headquartered in Houston, Texas.

The status of Barchart's Opinion trading systems are listed below. Please note that the Barchart Opinion indicators are updated live during the session every 10 minutes and can therefore change during the day as the market fluctuates. The indicator numbers shown below therefore may not match what you see live on the Barchart.com web site when you read this report.
Barchart technical indicators:
- 100% Barchart technical buy signals
- 60.40+ Weighted Alpha
- Trend Spotter buy signal
- Above its 20, 50 and 100 day moving averages
- 8 new highs and up 14.62% in the last month
- Relative Strength Index 75.13%
- Barchart computes a technical support level at 23.39
- Recently traded at 24.68 with a 50 day moving average of 21.04
Fundamental factors:
- Market Cap $914.39 million
- P/E 9.80
- Revenue expected to be down 27.70% this year buy up again by 5.10% next year
- Earnings are estimated to increase 216.90% this year and an additional 24.10% next year
- Wall Street analysts issued 1 strong buy recommendation
The 50 Day Parabolic Time/Price indicator has been a reliable technical trading strategy for this stock.
Disclosure:None.


