
Oracle Releases Mixed Quarterly Results
The market’s attention today will mainly be focused on 2 events: the release of the latest US inflation data and Apple's annual ‘Keynote’ event, which starts at 18:00 BST. During this Keynote the company is expected to present, amongst other things, the new iPhone 13, Apple Watch Series 7 and the new AirPods.

While we wait for the important inflation data and the news coming from Apple, we will focus our attention on the results presented yesterday on Wall Street. Specifically, the results for the first fiscal quarter of the technology giant Oracle, which covers the months from May to August.
Oracle presented mixed results after the market close, in which earnings per share exceeded market expectations whilst revenue fell short for the first time in a year. Specifically, Oracle posted earnings per share of $1.03 and revenues of $9.73 billion versus the expected figures of $0.97 per share and $9.76 billion of revenue.
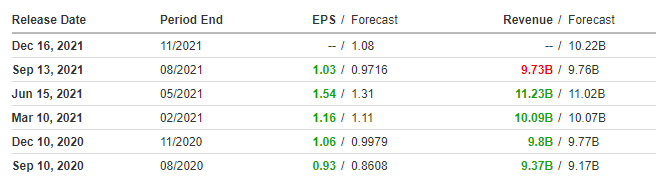
Source: Investing.com
Oracle has experienced a strong increase of 37.41% in the stock market so far this year, thus outperforming its Benchmark and continuing the increases of last year through an important bullish channel that began at the beginning of the year and led it to set a high of 91.78 dollars per share in August.
If we look at the daily chart, we can see that since the end of July, the price seems to have entered a sideways consolidation movement between the green and red bands that act as resistance and support levels respectively. Currently, the price is fighting to maintain its 18-session moving average in white and the important level of the 23.6% Fibonacci retracement that acts as the first support level. However, after yesterday's results, it is possible that the price will lose this level during today's session, due to the fact that, during the pre-opening, it is trading in negative territory, exceeding 1% at times.
The loss of this first support level opens the possibility for the price to perform a bearish impulse to its main support level - which is represented by the red circle in the area of the red band, the lower band of the bullish channel and the 38.2% Fibonacci retracement level. The loss of this important support level would open the door to a further price correction, endangering the current bullish trend.
This support level is very important and the price could form a bullish bounce at this point, although as long as it is not able to overcome its current resistance level we cannot expect a significant upward move.
(Click on image to enlarge)

Depicted: Admirals MetaTrader 5 – Oracle Daily Chart. Date Range: 28 July 2020 – 14 September 2021. Date Captured: 14 September 2021. Past performance is not a reliable indicator of future results.
Evolution of the last five years:
- 2020: 22.10%
- 2019: 17.34%
- 2018: -4.51%
- 2017: 22.96%
- 2016: 5.26%
Disclaimer: The given data provides additional information regarding all analysis, estimates, prognosis, forecasts or other similar assessments or information (hereinafter ...
more

