

(Click on image to enlarge)
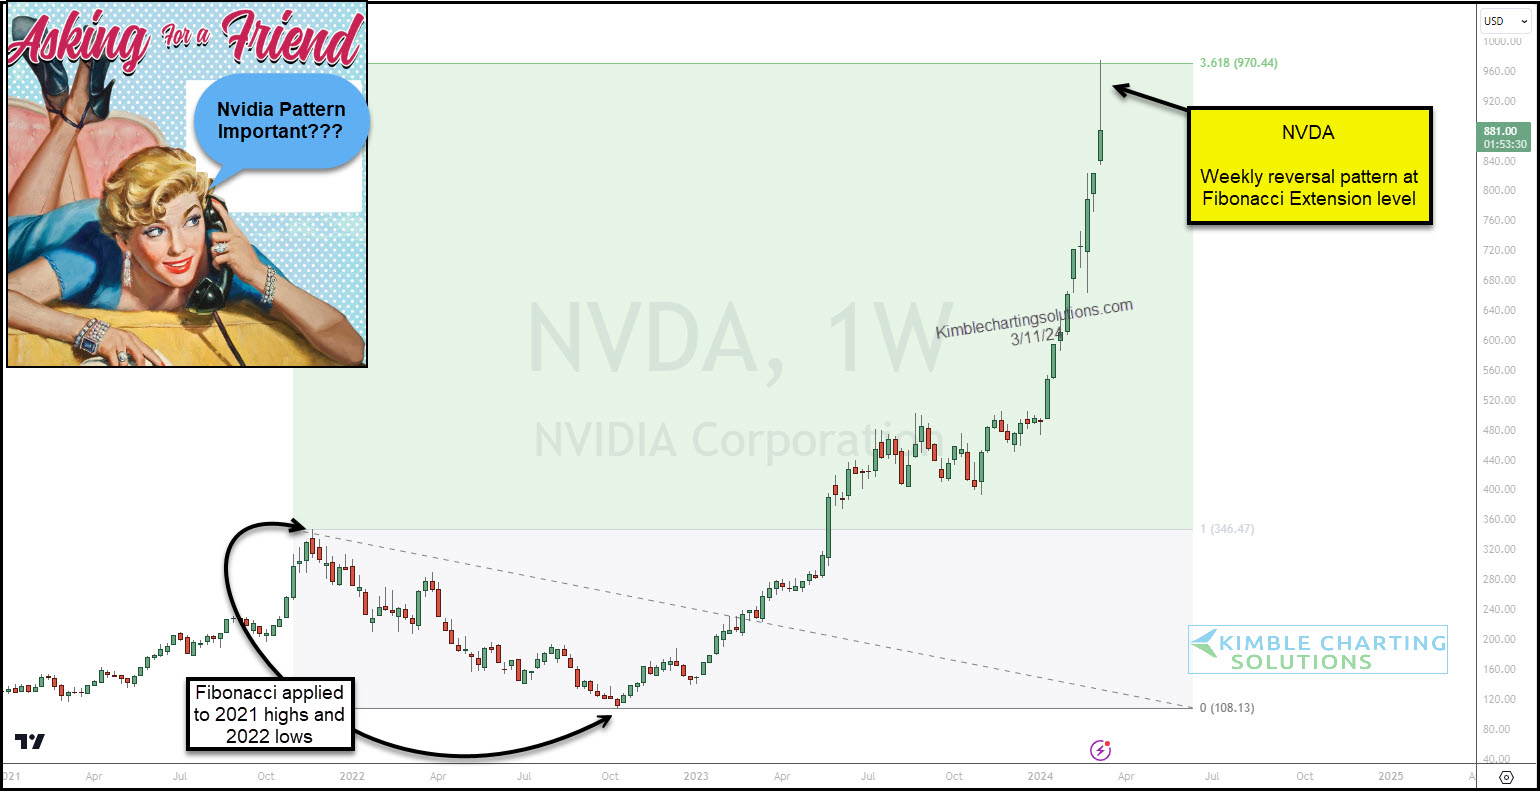
Nvidia’s stock price surged last week, reaching an important Fibonacci extension level (361.8).
The rally has been unprecedented. Nvidia (NVDA) is a large cap tech stock and its price has doubled in just 9 weeks!
But something happened last week. Nvidia’s formed a bearish reversal candle on the weekly chart. See chart above.
This is a rare pattern that often times will show up on aggressive/parabolic moves… and often times signals a trading top.
I’m wondering if this will end up being important? Stay tuned!!
More By This Author:
Is The U.S. Dollar Quietly Forming A Bearish Topping Pattern?Investor Sentiment Getting Greedy? Seems Unwarranted
Coinbase Stock Price Rally Putting In Bearish Reversal?



Comments
Log in or sign up to join the conversation.