
Nvidia Stock Chart Analysis: Major Sell Signal
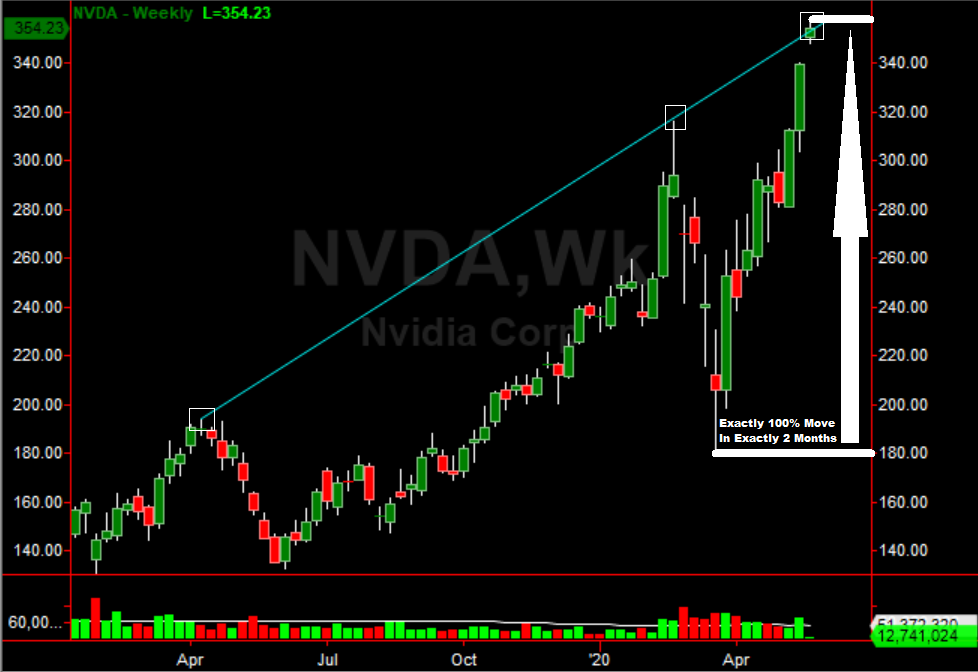
Shares of Nvidia Corp (NVDA) continue to grind higher, up another 4% on the day. The stock is hitting another new all-time high today, reaching $356.66. This stock is one of the hottest technology names since the lows of March 2020. On March 18th, 2020, Nvidia tagged $180. As of today (exactly 2 months later), this semiconductor stock is up 100%, almost exactly. That is semi-freaky. As a technical chart guru and chief market strategist, Nvidia stock chart analysis shows many other sell signals as well.
Aside from the symmetrical 100% move in exactly two months, the stock chart is hitting a major trend line of resistance. If you connect the high pivot from April 12, 2019, to the high pivot on February 21st, 2020, the line extends to exactly today’s highs (note the chart below). Lastly, the RSI just crossed 70+, a signal of being majorly overbought as well as the MACD signaling exhaustion.
The Nvidia stock chart analysis is clearly signaling a strong sell at these levels ahead of earnings on May 21st (after the close). I have shorted the stock myself and am looking to hold for at least a 10% correction.
(Click on image to enlarge)
Disclosure: None.


