
Now Playing: The Slow Grind

The State of the Market
For the past two weeks or so, the stock market (as defined by the S&P 500) has been grinding higher on a daily basis. Even when there is disappointing data on the economy, stocks find a way to advance by the time the closing bell rings - just a little.
The bulls argue that the market's slow walk is a good thing. We're told this means there isn't any real selling pressure or signs of speculation. We're told that the advance has broadened considerably and that the FANMAG winners aren't dominating the action these days. We're told that cash is coming off the sidelines now that the major indices have started making new highs again. We're told that the market is continuing to look ahead to better days. And we're told that corporate buybacks, which fell off a cliff in response to the COVID shutdown, are about to return. Party on, Wayne.
On the other side of the aisle, our furry friends are not as sanguine. They point to the recent speculation in call buying by the public (I.E., all those millennials that have discovered trading from their apartments) and the action in Tesla (TSLA) as signs that the market is getting more than a little frothy. They point to the slowing economic data. And the spike in COVID cases, hospitalizations, and deaths during the latest virus surge. And they point to the valuation charts, which have clearly reached extreme levels. As such, the folks in the bear camp say the current march higher is sure to end badly - as in, very badly.
Of course, this is what makes a market. And with one team's argument apparently being a little stronger/popular than the other, the result is a slow grind higher.
We've seen this movie before - lots and lots of times. And so far at least, Ms. Market looks to be following the script. Let's review.
First, stocks break out of an obvious range and move to new highs - by the skinniest of margins. Then they waffle. In the next scene, the indices move up enough for the technicians to validate the breakout. Then the good news starts to flow. In the process, stocks become overbought. Sentiment becomes overly optimistic. Complacency sets in as it becomes clear that trading stocks is great way to make money. Cue the "Happy Days are Here Again" music.
But, just about the time the audience assumes that stocks only move in one direction and that maybe adding some margin or leveraged long ETFs makes some sense, something comes out of the woodwork to put the bears back in business for a spell. Something to shake the confidence of the late-to-the-party buyers. Something that questions the bull case. I.E. Something bad.
Wham! Just like that, a month's worth of painstakingly slow gains evaporate within a day or two (or in this case, maybe an hour or two). Cutting to the chase, this is the movie I think we're seeing here.
Of course, I could be wrong. And yes, stocks could certainly march merrily higher into the New Year and beyond on the vaccine news. However, I think it is important to remember at times like these that the stock market is not a one-way street. And pullbacks/corrections happen - all the time.
So, my plan is to (a) enjoy the current slow grind higher and (b) be prepared for the next bump in the road.
The State of the Trend Indicators
The Trend Board is completely green. Advantage Bulls.
(Click on image to enlarge)
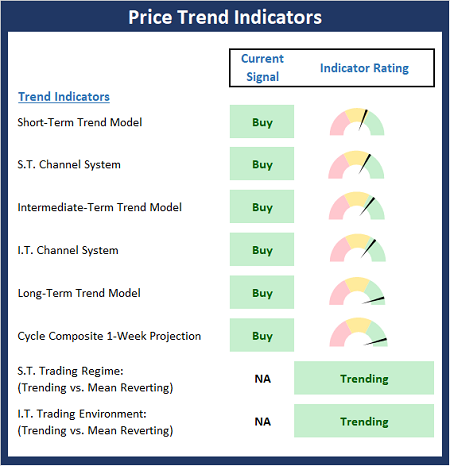
About The Trend Board Indicators: The models/indicators on the Trend Board are designed to determine the overall technical health of the current stock market trend in terms of the short- and intermediate-term time frames.
My Take on the State of the Charts...
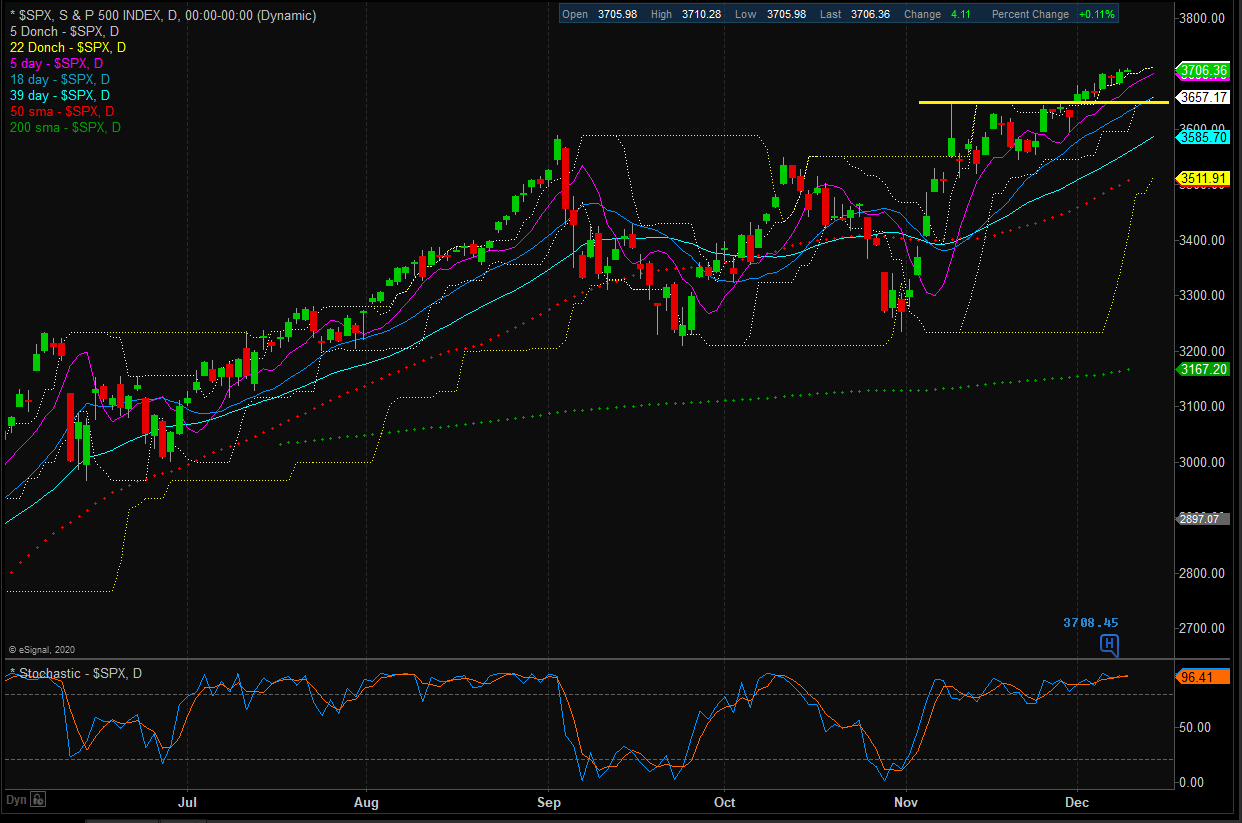
This remains a tale of two tapes as the S&P 500 looks to have broken out of the top end of the recent trading range and is now grinding higher. As long as the index doesn't dip back into the range, the bulls should retain possession of the ball.
S&P 500 - Daily
(Click on image to enlarge)
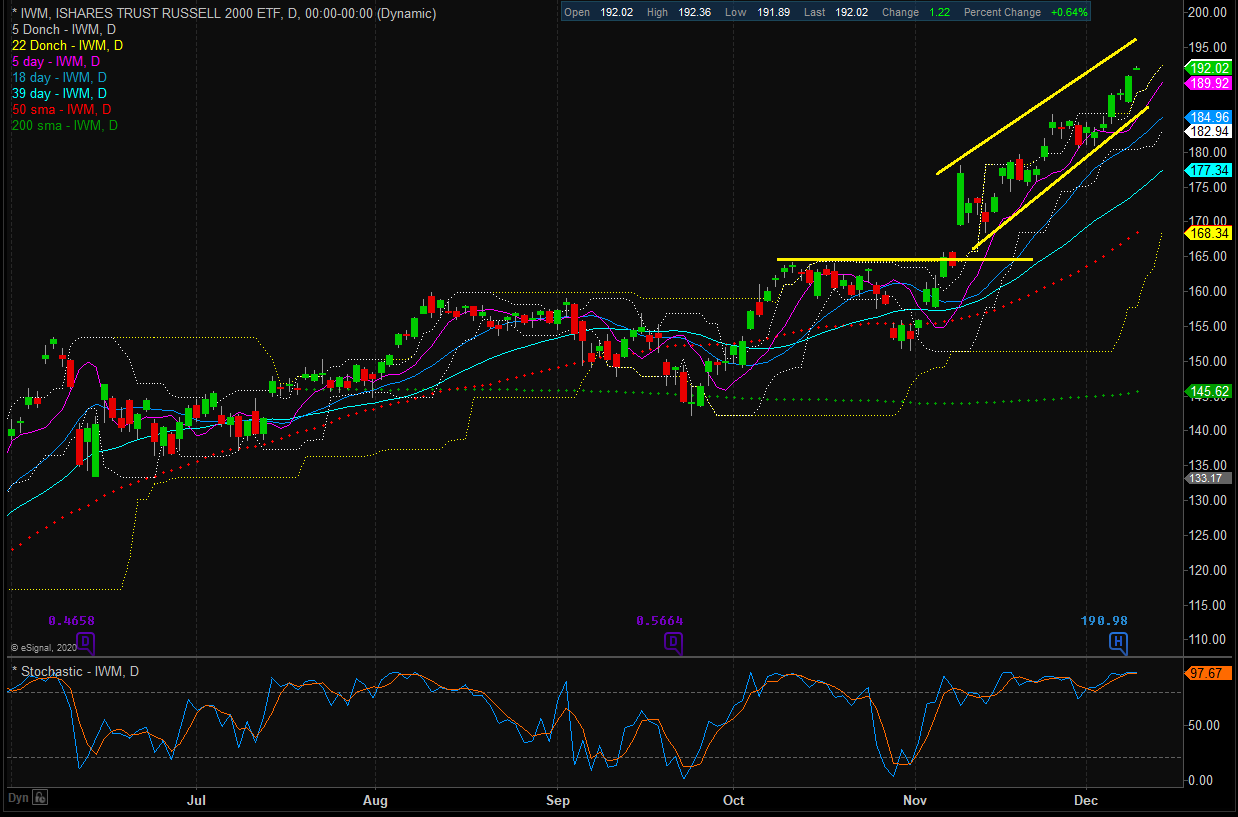
However, the Russell 2000 ETF (IWM), which is considered a proxy for the action in the small-cap space, presents a different picture. Instead of worrying about the validity of the breakout, the IWM has been movin' on up at an impressive (and record-breaking) clip. A few weeks ago, I suggested the early breakout of the range here was likely a "tell" for the broader market. So far anyway, this appears to have been the case.
Russell 2000 Small-cap ETF (IWM) - Daily
(Click on image to enlarge)
Next, let's check in on the state of the market's internal momentum indicators.
The Momentum board is also universally green. This suggests (a) there is some momentum behind the move and (b) a buy-the-dips strategy remains in play.
(Click on image to enlarge)
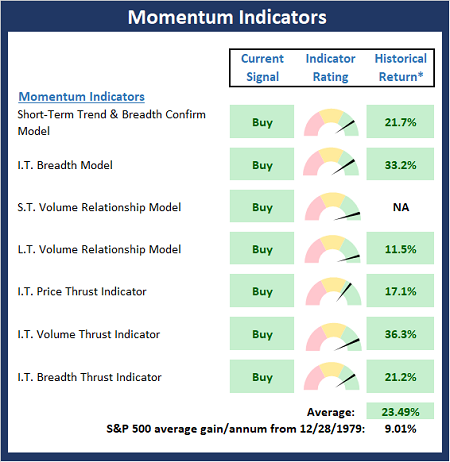
* Source: Ned Davis Research (NDR) as of the date of publication. Historical returns are hypothetical average annual performances calculated by NDR.
The opinions and forecasts expressed herein are those of Mr. David Moenning and may not actually come to pass. Mr. Moenning's opinions and viewpoints regarding the future of the markets should ...
more

