
Not All Dividends Are The Same Even When Their Yield Is Similar
The better informed the investor is, the better the investment decisions they can make. But being an informed investor can be a very arduous task, and some would even say that conducting research on common stocks is a real snoozer. Poring over mounds of financial data and trying to piece this information into meaningful and useful knowledge is not the average person’s idea of a good time. Most people have better things to do with their time yet recognize that making sound financial decisions is critical to their future.
It is logical to assume that the more you know about the companies you are investing in, the smarter you can be about making good choices. As previously stated, researching common stocks can be tedious, confusing, and complex. But investing in common stocks without thoroughly understanding what you are buying or what you own can be foolish and dangerous at the same time. Therefore, most would agree that a comprehensive and thorough research process before investing is prudent and necessary.
So, if you are not willing to do the job yourself, then hiring a professional that you believe is competent and you can trust is a reasonable course of action. Even then, most investors would be more comfortable with their portfolios if they understood what they own and why they own it. Knowledge is power, and regarding investing, I believe an essential key to achieving financial success and controlling the amount of risk taken to achieve it.
On the other hand, if turning your money over to a professional is not appealing, you could seek the assistance of research tools and or services. Although I am admittedly biased, the Dividend Kings’ marketplace service on Seeking Alpha provides individual dividend stock ideas as well as model portfolios to fit most every dividend investor’s needs. We also offer several tools to assist you in determining the safety and quality of the selections that are recommended.
Dividend Kings’ subscribers are also offered a discount on the Premium Monthly Subscription to FAST Graphs (fundamentals analyzer software tool). This powerful research “tool to think with” was developed and designed to make the important task of researching a company easier and more efficient. This tool is not designed to be the end-all, as I believe that no such tool could even exist. Instead, this tool was designed to make the process of researching a company not only easier and more efficient for the average investor, but also to provide a clear and instant perspective of the fundamental value and financial strength of each company they own or might be interested in owning. Therefore, subscribers are capable of instantly deciding whether the company they are considering is research worthy or not.
Important Considerations Before Investing
Before investing in a common stock, it just seemed logical to possess key information that reveals the quality and the value of the business being considered. Therefore, it just makes common sense to ask and answer some key questions about a business before laying your money down. For example, what kind of a track record has the company produced? What do their earnings and cash flows look like? How fast have they grown and how consistent has the growth been? Regarding the future, what is a rational expectation of how fast the company can grow going forward. These and other important questions are all logical knowledge to have before investing.
Additionally, regarding dividends, there are several questions that the discerning investor might ask: Are the dividends growing, and if so, at what rate and how consistently and for how long? Have they ever cut their dividend, and if they did, why? What about the payout ratio; is it reasonable and is it increasing or decreasing? Also, the investor might ask; what has been the cumulative total amount of dividends paid over a given period of time, and what has been the nominal yield and yield on cost (growth yield) that the stock has delivered? Also, are the dividends well covered by cash flow and free cash flow? Of course, what does the future growth potential of dividends look like?
There are other questions regarding a company’s fundamental values that a discerning investor should ask and answer. How has the market historically capitalized a given company’s fundamental results? In other words, what is a normal valuation that the market has historically applied? How do these valuations compare with other companies in other industries? And of course, most importantly, how is the market valuing the business today; is it overpriced, underpriced or fairly priced? Although this information requires a certain amount of interpretation on the part of the researcher, clear answers can greatly facilitate the decision-making process.
Questions like those above, and many more, are easy to ask but difficult to answer. Although the information is readily available on public companies, it must be pieced together from financial statements or other data sources. Once the information is gathered, then numerous calculations must be made to answer the proposed questions. As mentioned above, there are easier ways to get these important questions answered? The following look at three dividend-paying stocks through the lens of FAST Graphs will hopefully bring some light to the subject.
Two Dividend Stocks
I am going to examine two dividend-paying companies that, at first glance, appear to possess very similar fundamental attributes. Each of these companies are currently offering a similar dividend yield that is more than the yield available on an S&P 500 index fund. Also, each of these companies are trading at similar current valuations as follows:
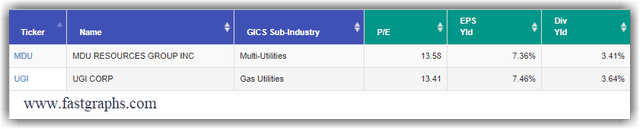
From the information above, each of these companies appears to offer very similar (almost but not quite identical) dividend yields, and their current valuations are very similar. On the other hand, the information above lacks offering us critical knowledge of the company’s history and the fundamental records that they have achieved. Statistically, the businesses look very similar. However, there is much that can be learned from the past if the important information is readily available.
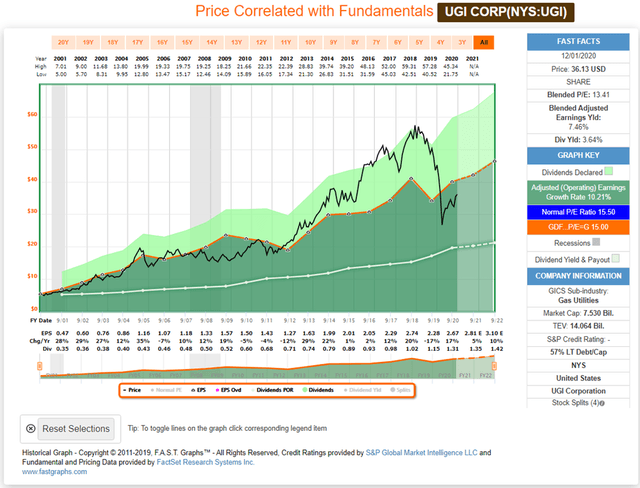
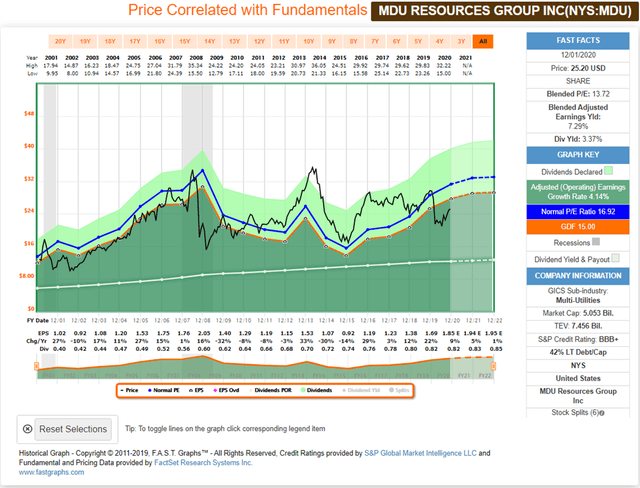
Therefore, let us look at each company from the perspective of historical earnings and dividends only. The three figures below visually depict each company’s earnings record (orange line with white triangles) since calendar year 2001.
The black line indicates monthly closing stock prices correlated to the orange earnings justified valuation lines. Now, again, in an instant, you receive answers to many of the important questions that were asked in the above paragraphs. First, you can see how stock prices have tracked and correlated to earnings. You can also see how the market has historically valued each company and therefore easily determine on that basis whether (or not) the market is fairly valuing each respective company at present time. The growth rate of earnings achieved is listed to the right of the historical graph and the calculated True Worth price-earnings ratio applied to the orange earnings justified valuation line is indicated in the orange rectangle.
The green shaded area represents earnings, and the light green shaded area represents dividends paid out of earnings. Therefore, immediately, you can see how consistent and how fast earnings growth has been and the level of dividends that have been paid out of those earnings is also visible. Additional vital fundamental information can be gleaned from a quick review of each graph.
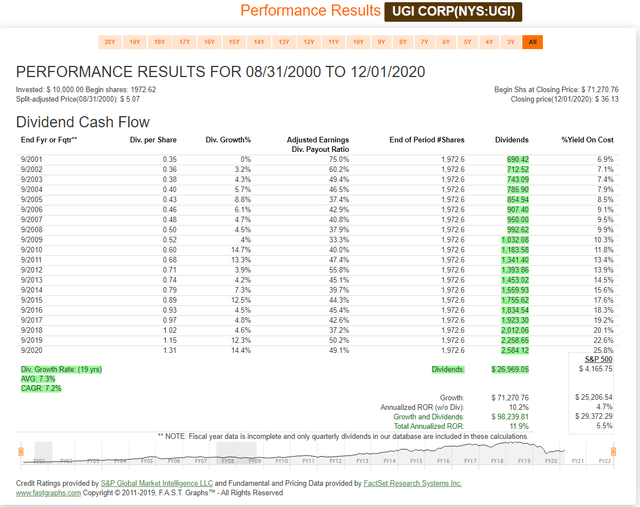
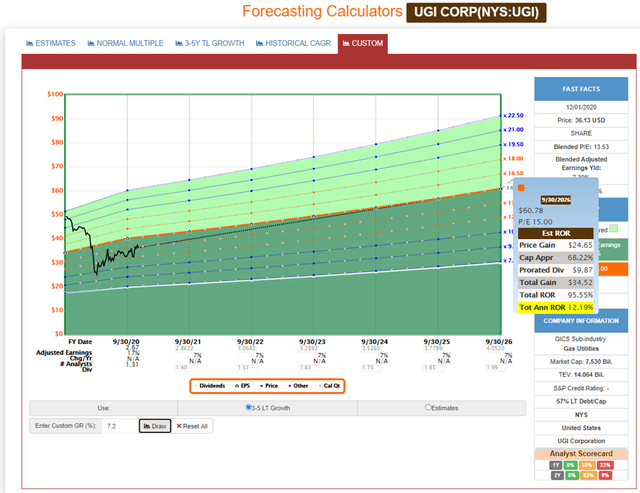
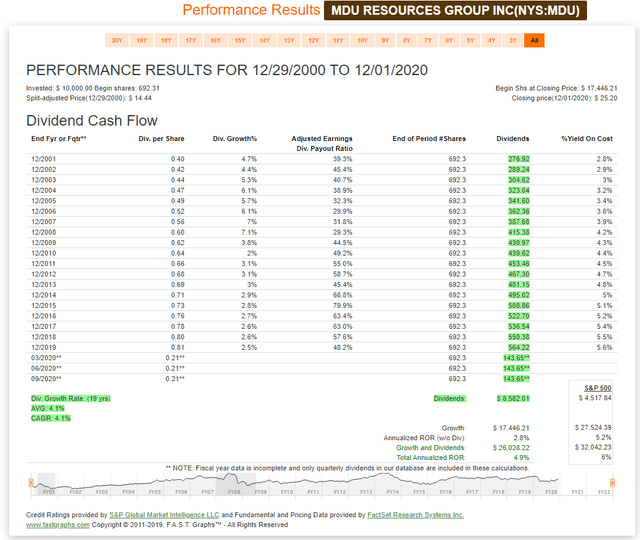
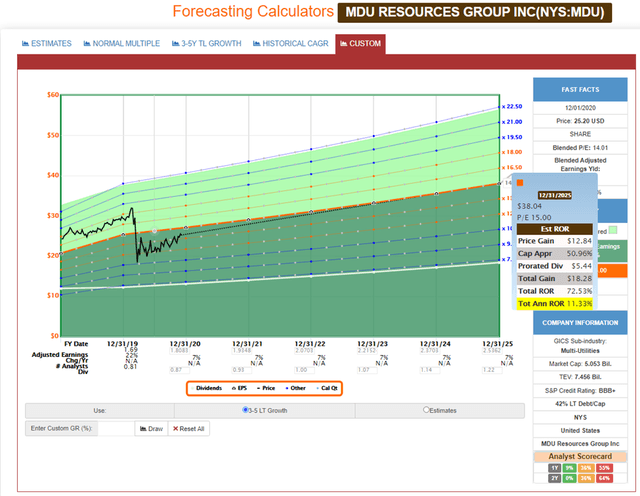
The performance reports allow you to answer many of the questions regarding the company’s dividends that were suggested above. Finally, the forecasting graphs provide a perspective of what analysts currently expect going forward.
UGI Corp (UGI)
MDU Resources Group (MDU)
FAST Graphs Analyze Out Loud Video: UGI versus MDU
Since a picture is worth a thousand words, and a video many more, I will review and explain what I have discussed in this article in the following short video.
Conclusion
Not all dividends are the same, even when they appear to be. Having a clear perspective of a company’s past can offer important insights into the future. However, the past is not necessarily indicative of the future. Therefore, comprehensive research is always suggested. With that said, there is nevertheless a lot that can be learned from the past.
Disclosure: Long UGI
Disclaimer: The opinions in this article are for informational and educational purposes only and should not be construed as a recommendation to buy or sell the stocks ...
more

