
No Reason Yet To Get Bullish
The short-term uptrend that started on Wednesday continued through Friday. I am not participating, though. I didn't have the courage to jump in at the lows. In fact, it was all I could do to gather the courage to cover the hedges.
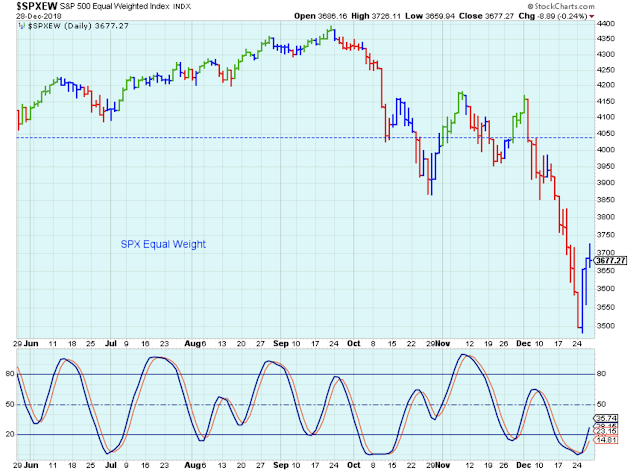
This is one of the few times that I am relying primarily on the short-term momentum indicator shown below to judge the trend. Usually, I like to have confirmation from the breadth indicators, but stocks have been so pummeled by selling that breadth was insanely negative, and so there was no positive divergence available.
From the looks of this chart, this short-term uptrend has plenty of room to run. This is, if the news from the White House, and the economic indicators cooperate.
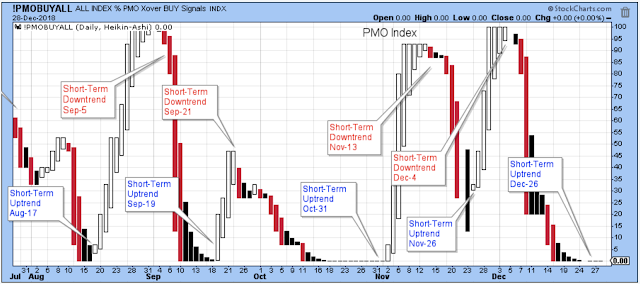
Here is a look at the PMO Index. It isn't very helpful in this environment. Or, I should say, it hasn't been helpful so far this week.
This chart shows that new 52-week lows have decreased dramatically, but there are still almost no new 52-week highs.
An uptrend that is going to exceed the short-term requires a number of new 52-week highs, so there is no reason yet to get bullish. But the lack of new lows is certainly important good news.
I will be watching this chart everyday. If the market is going to start another leg lower, the number of new lows will provide plenty of warning which is why this is by far my favorite market breadth indicator.

The Longer-Term Outlook
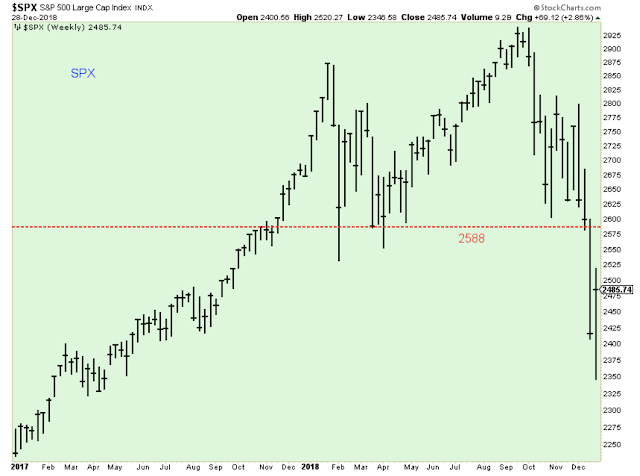
In the week before Christmas, almost every major index hit a new 52-week low. It was a critical week for the market.
The weekly chart below shows that the 2588-level on the SPX is the 52-week closing low (not intra-week). This is an important line in the sand for the market because if we are to believe that this decline in prices is just a significant correction within a larger uptrend, then the market needs to exceed this 52-week level.
Even if the SPX remains below this level, how do we know if the market is in a money-losing downward trend, or whether it is just in a consolidation where we can profit by trading the best performing stocks? After all, the market has risen dramatically over these past 10 years and even if the economic news were positive it would still need to consolidate these gains.
To know whether the market is trending lower or just consolidating, I am thinking that you have to watch to leading growth stocks such as the semiconductors shown in the chart below.
Considering just how terrible the market has been this winter, this chart really doesn't look too bad to me. This could be a very healthy sideways price pattern. Of course, it could also be building a major head-and-shoulders style top, but we just have to wait and see. My point, though, is that with the leading growth stocks still hanging on, then there is hope for the broader market.
In other words, don't get too bearish.

But don't get bullish either. The ECRI Index was stable for a few weeks, but now it has started to tick lower again, and it is getting very close to the market-breaking -5 level where the economy is too weak to support stock prices.
If the ECRI Index starts to drop below -5, then I will be forced to start selling some of my remaining holdings if I am to follow my own trading/investing rules. Not every drop under -5 results in a major bear market, but this is the condition under which some major declines have started.
This index can surprise you. Just when you think it is ready to sink lower and lower, it can turn around and start to move higher... and just when your bearishness seems unquestionable. The turn higher for this index is when your contrarian instincts need to kick in. It is the magic signal to consider deploying cash again.

Gold bugs like me are watching this chart. I don't why I care about gold stocks, but I do. I guess because gold is a mystery I want to solve.
Will the bugs break out above, or start another major leg lower? I think it is best to stay on the side of the larger trend, so until this downtrend breaks, I am not a believer. Simple as that.

Do you believe in this type of cycle analysis? I haven't decided. This is from SwingTradeCycles.

Here is my own version of the chart. It does fall close to major lows. Still, I am not sure this type of analysis is valid. I was using it earlier in the year, but then I felt silly.

Outlook Summary:
The long-term outlook is negative and continues to weaken.The medium-term trend is down as of Oct. 4. The short-term trend is up as of Dec.26.
The medium-term trend for bond prices is up as of Nov-16 (prices higher, yields lower).
Investing Themes:
Cash
Inverse Funds
Strategy During a Bull Market:
- Buy large cap stocks and ETFs at the lows of the medium or short-term trends.
- Buy small cap growth stocks on breaks to new highs in the early stages of short-term up trends.
- Stop buying when the short-term trend is at the top of the range.
- Take partial profits when the uptrend starts to struggle at the highs.
- Never invest based on personal politics.
Disclaimer: I am not a registered investment advisor. My comments above reflect my view of the market, and what I am doing with my accounts. The analysis is not a recommendation to buy, ...
more

