Nine Dow Stocks With The Most Bearish Charts
No matter how well or how poorly a stock index is performing, there are always laggards and leaders. Traditional advice would encourage investors to concentrate on the winners and avoid the losers (of course, the losers could also be shorted). Contrarians, who think the Dow is going to become more bullish, might want to follow the worst performing stocks (the idea behind the “Dogs of the Dow” investing strategy). A third approach would be to concentrate on the stocks in the index with charts that are transitioning from a bearish to bullish pattern. This article discusses the stocks in the Dow with the weakest charts at the end of the first quarter in 2016.
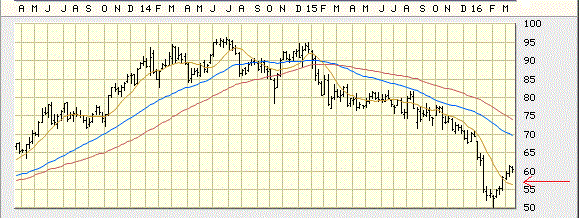
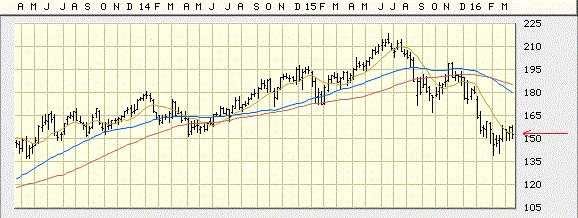
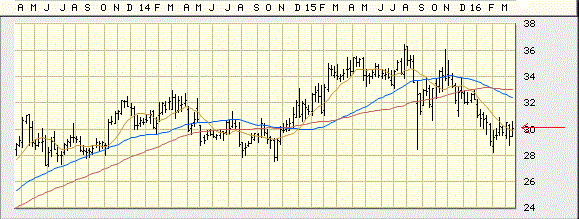
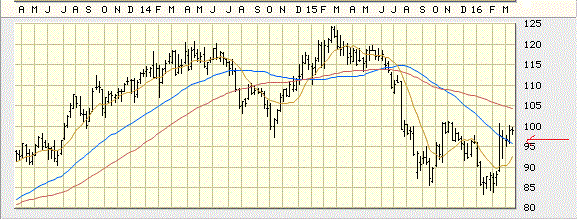
To determine bearishness, we will use three moving averages, the 10-week, 40-week, and the 65-week (same as the 50-day, 200-day and 325-day). In the most bearish pattern, all three would be heading down with the 65-week (red line) above the 40-week (blue line), which in turn would be above the 10-week (yellow line). The sharper the decline of the two longer-term averages the more bearish the chart and the greater the distance of the 10-week below the 40-week, the more bearish the chart. A stock’s price relative to the moving averages is important. Below and around the 10-week is the most bearish. Price rising above the 40-week indicates a possible improvement, however. Price of a stock rising to the 65-week is even better because moving above that line indicates a bullish transition might take place (it will be necessary for price to mostly stay above that line for that to happen).
Based on our criteria, the Dow stocks with the most bearish charts are American Express (AXP), Goldman Sachs (GS), and Pfizer (PFE). The moving averages for American Express are all moving down at sharp angles and the 10-week is well below the 40-week. The stock has traded mostly below the 10-week for many months, until it recently moved above it. The 40-week and 65-week moving averages for Goldman Sachs and Pfizer are closer together, which is better, but the 10-week is still well below them. Their stock prices are clinging to the 10-week.
American Express (AXP) Three-Year Weekly Chart
Goldman Sachs (GS) Three-Year Weekly Chart
Pfizer (PFE) Three-Year Weekly Chart
The charts for United Technologies (UTX), Apple (AAPL), Merck (MRK), and Boeing (BA) are somewhat better than the first three. The 10-week moving averages are rising for all of them, which is a weak positive. United Technologies stock price has actually gone above the 40-week, which is a bigger plus. Its chart is more negative than the other two stocks because the 40-week and 65-week are widely separated and moving down at sharp angles. The price of Apple has yet to move above the 40-week, but is getting close. Merck has done it and so has Boeing. Boeing is in the best shape of the group because its 65-week moving average is flattening out and has even moved slightly up.
United Technologies (UTX) Three-Year Weekly Chart
Apple (AAPL) Three-Year Weekly Chart
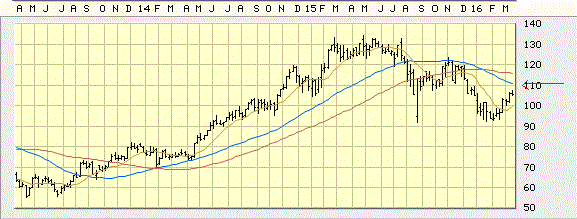
Merck (MRK) Three-Year Weekly Chart
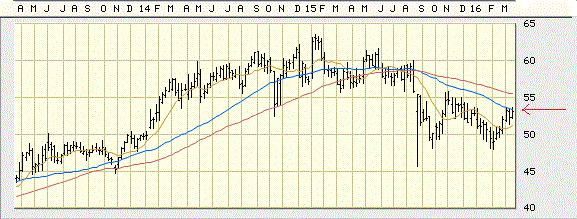
Boeing (BA) Three-Year Weekly Chart
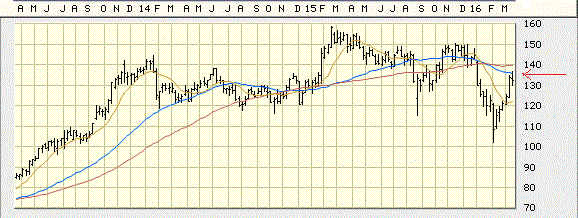
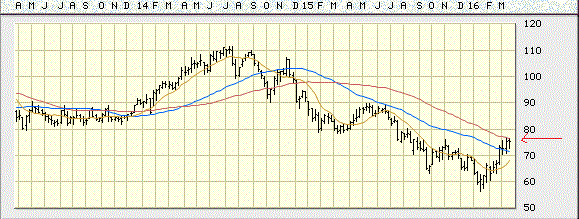
Even stronger, but still bearish, are the charts of IBM (IBM) and Caterpillar (CAT). The price of IBM is just below the 65-week moving average, but it has been there before and failed to break out above it (see red arrows). Caterpillar has also reached this area of key resistance and is currently stuck at it.
IBM (IBM) Three-Year Weekly Chart
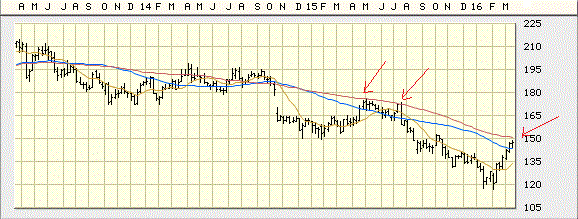
Caterpillar (CAT) Three-Year Weekly Chart
What would it take for the charts of these nine stocks to turn bullish from their current bearish profiles? At a minimum, the 10-week moving average would have to move above the 40-week and then the 65-week (a Double-Golden Cross). This in itself wouldn’t do it, however. It would only mean that there is a good chance that the moving averages would realign into a bullish pattern (the inverse of the bearish one). This would take many months. There are already several stocks in the Dow that are in various stages of this metamorphosis. Two additional stocks, Disney (DIS) and JP Morgan (JPM), have been bullish, but their charts are weakening and may turn bearish. Whether or not they join the nine stocks discussed here, remains to be seen.
None.


