
New Stocks On Most Attractive And Most Dangerous Lists: September 2015

Recap from August Picks
Our Most Attractive Stocks (-6.4%) fell less than the S&P 500 (-8.9%) last month and outperformed as a long portfolio. Most Attractive Large Cap stock NVIDIA Corporation (NVDA) gained 5% and Most Attractive Small Cap stock MBIA Inc. (MBI) was up 17%. Overall, 26 out of the 40 Most Attractive stocks outperformed the S&P 500 in August.
Our Most Dangerous Stocks (-9.5%) fell by more than the S&P 500 (-8.9%) last month and outperformed as a short portfolio. Most Dangerous Large Cap stock, Charles Schwab Corp. (SCHW), fell by 18% and Most Dangerous Small Cap Stock, El Pollo Loco Holdings, Inc. (LOCO), fell by 35%. Overall, 18 out of the 40 Most Dangerous stocks outperformed the S&P 500 in August.
The successes of the Most Attractive and Most Dangerous stocks highlight the value of our forensic accounting. Being a true value investor is an increasingly difficult, if not impossible, task considering the amount of data contained in the ever-longer annual reports. By analyzing key details in these SEC filings, our research protects investors’ portfolios and allows our clients to execute value-investing strategies with more confidence and integrity.
22 new stocks make our Most Attractive list this month and 28 new stocks fall onto the Most Dangerous list this month. September’s Most Attractive and Most Dangerous stocks were made available to members on September 2.
Our Most Attractive stocks have high and rising return on invested capital (ROIC) and low price to economic book value ratios. Most Dangerous stocks have misleading earnings and long growth appreciation periods implied by their market valuations.
Most Attractive Stock Feature for September: HCA Holdings (HCA: $85/share)
HCA Holdings (HCA), which operates hospitals and surgery centers across the nation, is one of the additions to our Most Attractive stocks list for September.
HCA Holdings has used its market leading position, believed to be the largest hospital operator in the world, to build a highly profitable business. Since 2012, HCA has grown revenue and after-tax profit (NOPAT) by 5% compounded annually.
Figure 1: HCA Holdings Increasing NOPAT
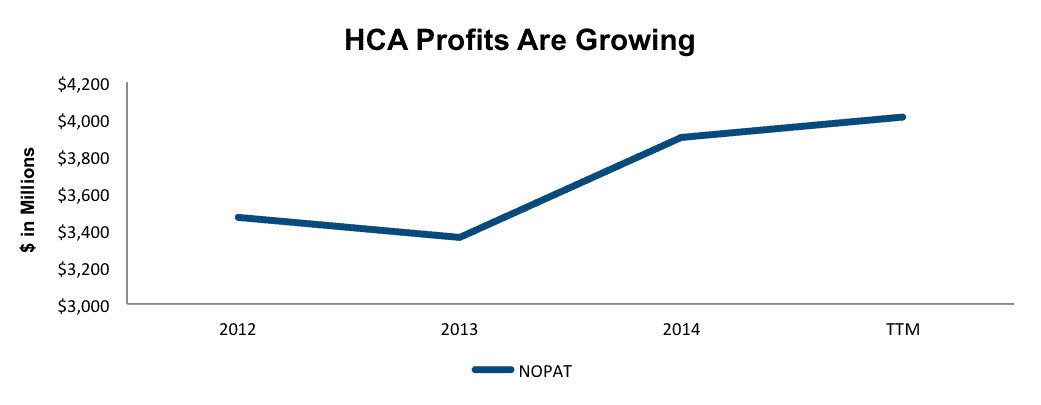
Sources: New Constructs, LLC and company filings
In addition to growing profits, HCA has maintained efficiency over the capital invested into its business, which has contributed to HCA’s top-quintile return on invested capital (ROIC) of 15%. Best of all, HCA Holdings has generated positive economic earnings every year since 2011.
Impacts of Footnotes Adjustments and Forensic Accounting
In order to derive the true recurring cash flows, an accurate invested capital, and a real shareholder value, we made the following adjustments to HCA Holding’s 2014 10-K:
Income Statement: we made $3.5 billion of adjustments with a net effect of removing $2 billion of unusual expenses (5% of revenue). We removed $2.7 billion related to non-operating expenses and $726 million related to non-operating income.
Balance Sheet: we made $3.6 billion of adjustments to calculate invested capital with a net increase of $478 million. The largest adjustment was $1.4 billion added back to invested capital (5% of net assets) due to off balance sheet debt in the form of operating leases.
Valuation: we made four adjustments with a net effect of decreasing shareholder value by $34.7 billion. There were no value increasing adjustments. One of the largest adjustments was a $1.5 billion (4% of market cap) decrease to shareholder value related to the fair value of minority interests.
HCA Holdings Shares Remain Undervalued
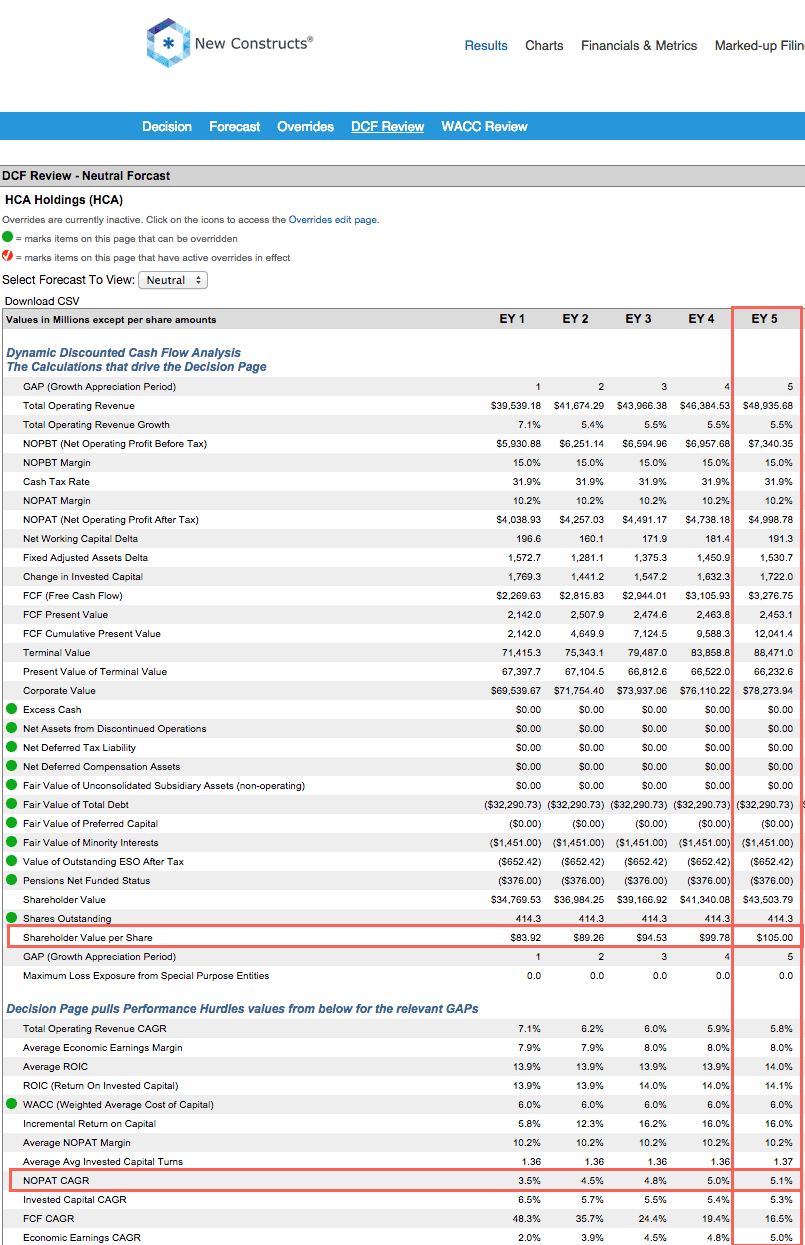
Despite increasing 16% year-to-date, HCA still has great upside. At its current price of $85/share, HCA has a price to economic book value (PEBV) of 1.1. This ratio implies that the market expects HCA’s NOPAT to only grow by 10% over the life of the corporation. Such low expectations are at odds with the company’s NOPAT growth since 2012 and should be easily surpassed.
If HCA Holdings can continue growing NOPAT by 5% compounded annually for the next five years, the stock is worth $105/share today – a 24% upside.
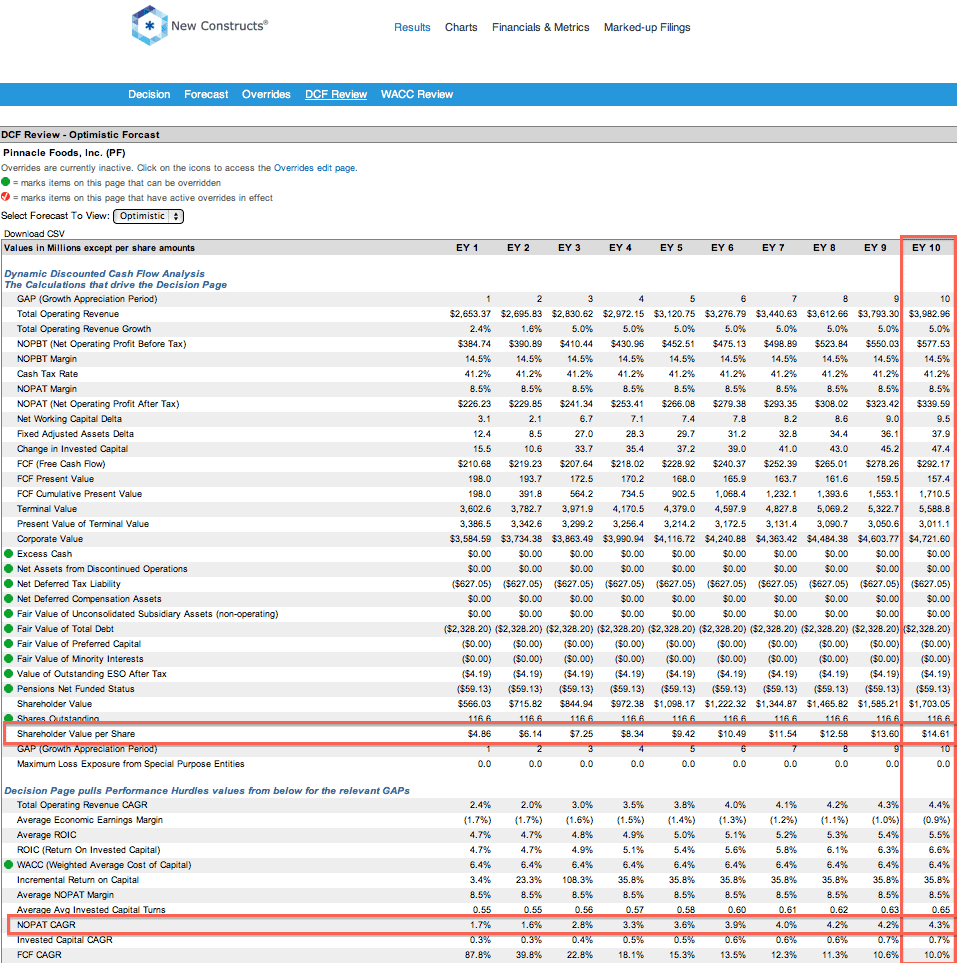
Most Dangerous Stock Feature: Pinnacle Foods, Inc. (PF: $45/share)
Pinnacle Foods, Inc. (PF), provider of an assortment of packaged food products, is one of the additions to our Most Dangerous stocks list for September and was in the Danger Zone in March 2015.
The market has rewarded Pinnacle Foods for acquisitions that have helped grow the company’s top and bottom line, but have come at a cost ignored by most traditional analysis. Despite GAAP net income growing nearly 70% compounded annually since 2012, economic earnings, the true cash flows available to equity investors have drastically declined.
The big difference between net income and economic earnings is the cost of off balance sheet liabilities and equity capital, something GAAP earnings ignore. In 2014, the capital charge for Pinnacle’s off balance sheet liabilities and equity capital equaled $2.38/share. After adjusting reported earnings for this charge, we find that Pinnacle’s economic earnings per share were -$0.49 compared to a GAAP EPS of $2.13 in 2014. While growing EPS and propping the stock price up, Pinnacle has been destroying true shareholder value, as shown in Figure 2.
Figure 2: Disconnect Between GAAP Earnings and Economic Earnings
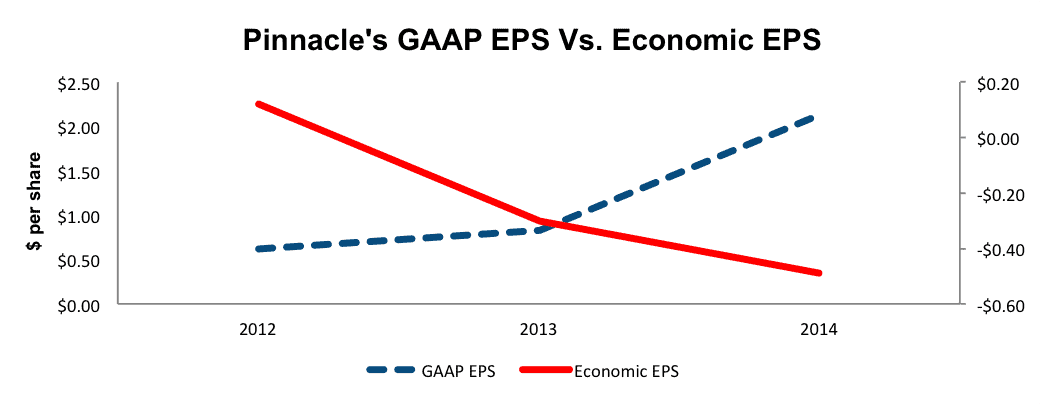
Sources: New Constructs, LLC and company filings
Forensic Accounting Reveals Overstated EPS
The following adjustments were made to Pinnacle Food’s 2014 10-K:
Income Statement: we made $306 million of adjustments with a net effect of removing $26 million in unusual income. The largest adjustment was the removal of $153 million (6% of revenue) in non-operating income received as a termination fee of Hillshire Farms’ withdrawn buyout.
Balance Sheet: we made $465 million of total adjustments to calculate invested capital with a net decrease of $101 million. The largest adjustment was the removal of $184 million (4% of net assets) due to midyear acquisitions.
Valuation: we made four adjustments with a net effect of decreasing shareholder value by $3 billion. There were no value increasing adjustments. The largest adjustment was the removal of $627 million (13% of market cap) from shareholder value due to deferred tax liabilities.
After Making Adjustments, It’s Clear Pinnacle Is Overvalued
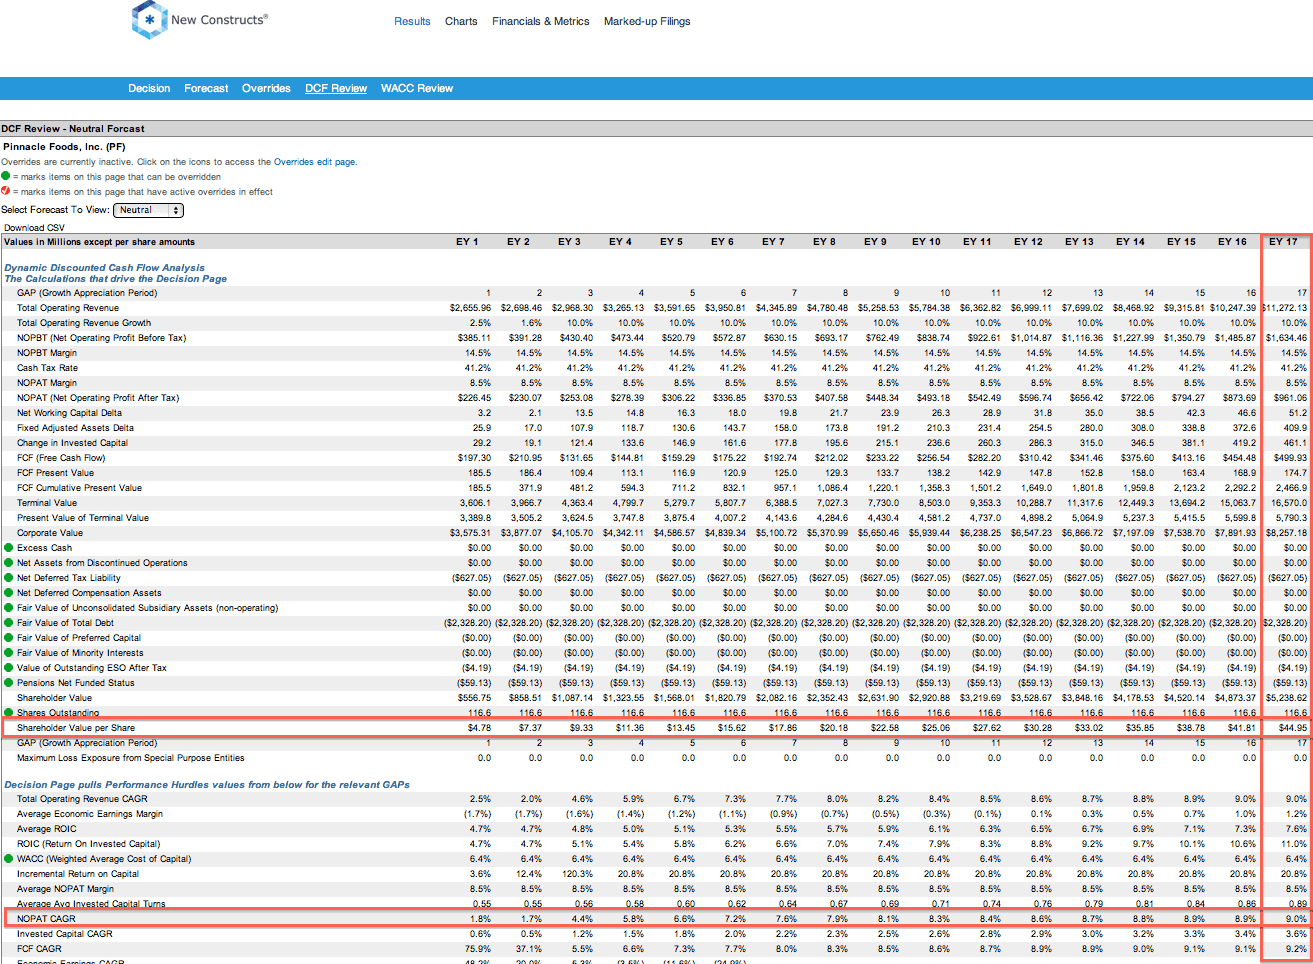
Year-to-date, PF has increased 26%, buoyed by increasing GAAP EPS. This price increase has left shares significantly overvalued. To justify its current price of $45/share, Pinnacle must grow NOPAT by 9% compounded annually for the next 17 years. While this may not seem like much, keep in mind that Pinnacle has only grown NOPAT by 2% compounded annually since 2012.
Even if Pinnacle is able to achieve a more realistic, but still optimistic compared to its past, NOPAT growth of 4% compounded annually for the next decade, the stock is worth only $15/share today – a 67% downside. With such lofty growth expectations baked into the stock, it’s easy to see why Pinnacle lands on Septembers’ Most Dangerous Stocks list.
Click here to download a PDF of this report.
Photo Credit: GotCredit
Disclosure: New Constructs staff receive no compensation to write about any specific stock, sector, or theme.


