
Nasdaq 100 To S&P 500 Ratio Nears Record
The ratio of the Nasdaq 100 to the S&P 500 rose to 3.26 as of yesterday’s close. As shown below, this is as high as the ratio has been since the peak of the Dot Com Bubble back in early 2000. In fact, there have only been two trading days in the history of the Nasdaq that have seen a higher ratio — March 9th and March 10th of the year 2000. March 10th, 2000 turned out to be the peak for the Nasdaq at the very top of the Dot Com Boom. The index would go on to fall 66% over the next two years.

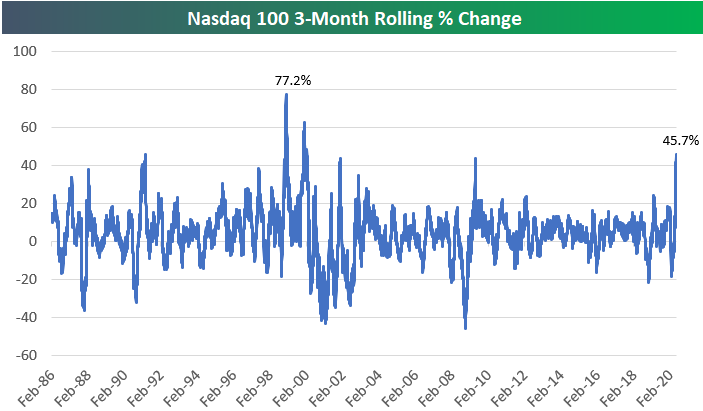
There has of course been a lot of discussion recently about the Nasdaq’s huge run higher since late March. We are now exactly three months past the low point of the COVID Crash on March 23rd, and as shown below, the Nasdaq 100 is up 45.7% since then. This three-month period has been the strongest run the Nasdaq 100 has experienced since the Dot Com Boom of the late 1990s.
While a 45.7% three-month gain is definitely huge, there were stronger three-month periods in 1999 and early 2000. On January 20th, 2000, the rolling 3-month return hit 62.63% for the Nasdaq 100, while on January 11th, 1999, the reading was +77.2%!
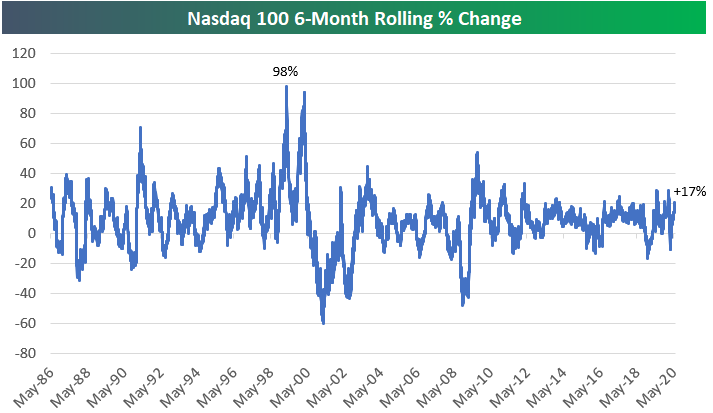
One important difference between the recent three-month run for the Nasdaq 100 and the runs experienced in the late 1990s is the level of the index at the start of the rally. Prior to the current 45% rally, the Nasdaq had fallen 20% over the prior three months. This leaves the index up 17% over the past six months. That’s still a strong six-month gain, but it doesn’t even register as an outlier when looking at the six-month rolling performance chart below. During the late 1990s, there were two six-month periods that each saw gains of nearly 100%.
Click here to view Bespoke’s premium membership options for our best research ...
more

