
Nasdaq 100, Dow Jones, S&P 500 Forecasts For The Week Ahead
Rising yields continue to pressure equity markets but the Dow Jones remains within reach of record levels, as the Nasdaq 100 stumbles into correction territory. Since the Nasdaq’s intraday record was tagged on February 16 to the intraday low on March 5, the tech-heavy index shed more than 12% before paring some losses. In the same span, the S&P 500 had declined less than 6% with the Dow Jones off less than 5% at its trough before surging to a new record high Monday. The diverging performances highlight the ongoing reflation trade.
US INDICES PRICE CHART: 4 - TIME FRAME (JANUARY 2021 – MARCH 2021)
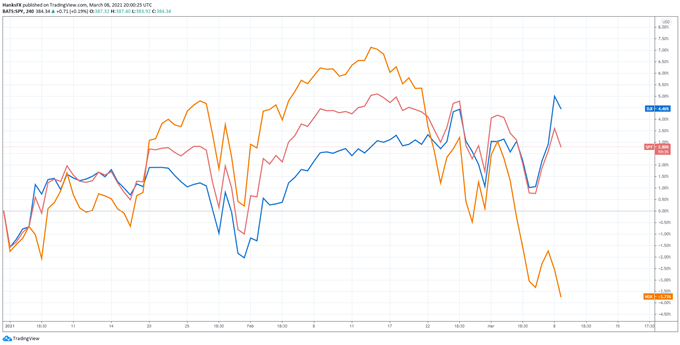
That said, rising yields are largely founded on expectations of a strong economic recovery, providing an encouraging backdrop for corporate earnings in the months ahead. Suffice it to say, current turbulence may give rise to greater strength down the line as it serves as healthy consolidation for the white-hot technology stocks that dragged the broader US indices higher since March 2020.
NASDAQ 100 PRICE OUTLOOK
In the meantime, however, the Nasdaq 100 continues to bleed lower. Losses have seen the index breach various levels of technical support with its September high, around 12,466, serving as the most recent casualty.
NASDAQ 100 PRICE CHART: DAILY TIME FRAME (MARCH 2020 – MARCH 2021)
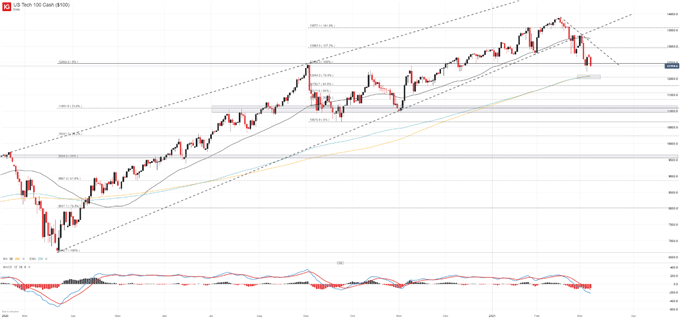
With significant breakdowns occurring, further support might be required before the Nasdaq can regain its footing and continue higher consistently. With that in mind, it can be argued the 200-day moving average around 12,000 is the next major level with rout-stopping potential.
NASDAQ 100 PRICE CHART: 4 - HOUR TIME FRAME (OCTOBER 2020 – MARCH 2021)
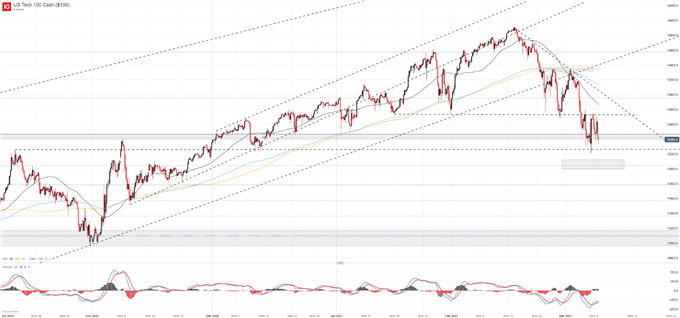
Traders can look to approach a technically weakened Nasdaq and a stronger Dow Jones through bullish exposure to the Dow Jones and simultaneous bearish exposure to the Nasdaq 100. Such positioning would be well suited if the rotation trend continues but is not without considerable risk. Further still, the odds of profit and loss are evenly balanced in trading.
DOW JONES PRICE OUTLOOK
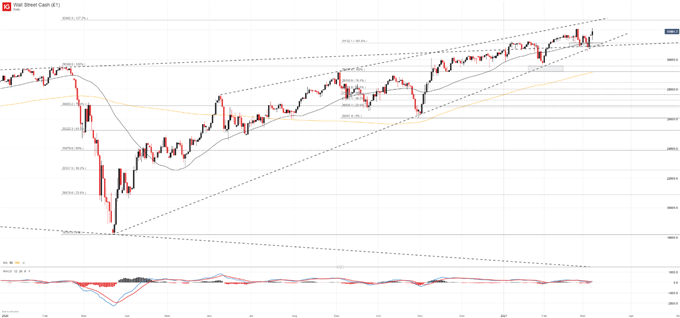
In the case of the Dow Jones, traders should eye confluent support from 31,130 to 30,800 as a breach beneath the zone could give way to further losses. If weakness spreads beyond technology stocks it could suggest the fundamental backdrop has been altered and risk appetite might pullback more broadly as a result. That said, there is little to suggest such a rotation will occur as it remains unlikely the Federal Reserve will consider raising rates anytime soon and economic projections climb.
DOW JONES PRICE CHART: DAILY TIME FRAME (JANUARY 2020 – MARCH 2021)
Disclosure: See the full disclosure for DailyFX here.


