
Momentum Investing: What Happens If We Boot Stocks Over 10x P/S?

Image Source: Pexels
The short answer upfront is: very little (of course, results may vary based on how many stocks one puts in the portfolio). This was a simple question posed to me by one of our readers – what impact does excluding stocks trading at 10x P/S have on a Momentum portfolio?
A good question – especially for those who are “value” investors that are interested in momentum. For most systematic value investors, the prospect of adding stocks trading at over 10x P/S sounds ludicrous – see this article on the performance of stocks trading over 10x P/S.
Since I didn’t know the exact impact, I went and ran the tests described below.
Data
The universe is the largest 1,500 common stocks in the U.S. Data is from FactSet. The data runs from Jan. 1, 1992 through Dec. 31, 2021. Momentum portfolios are constructed every quarter (Dec. 31, March 31, June 30, Sept. 30) by selecting the top quintile (300 firms). Returns are shown to equal-weight (EW) portfolios.
Within this top quintile of momentum stocks, I then bifurcate the sample into the following:
- Above 10x P/S.
- Below 10x P/S.
The image below shows the number of firms in each bucket.
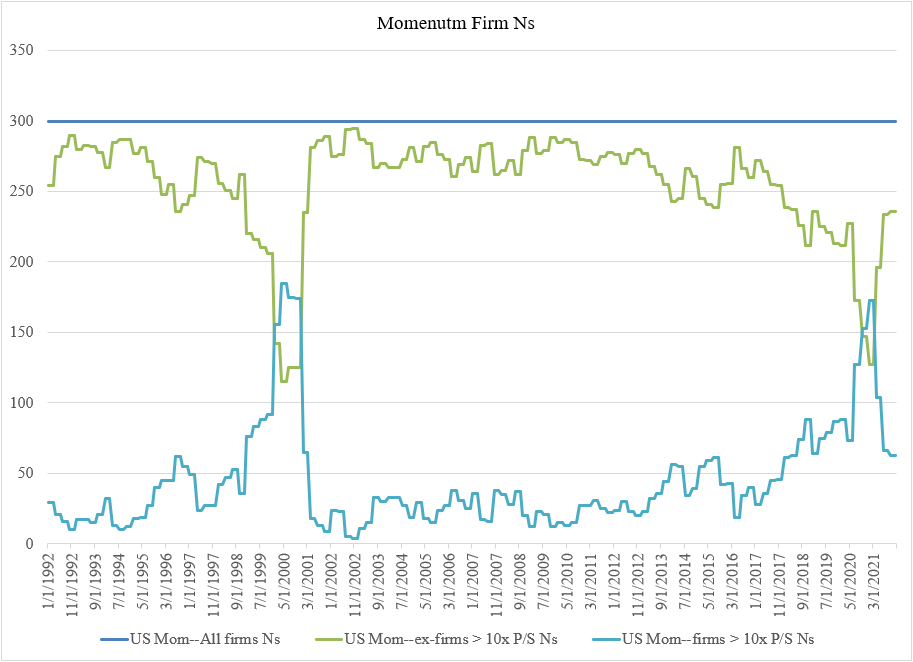
As we can see, there are two time periods when the momentum portfolio has a decent amount of firms trading above 10x P/S (100 firms or more):
- Post Internet bubble – Jan. 1, 2000 - Dec. 31, 2000.
- Post COVID-19 – July 31, 2020 - June 30, 2021.
However, the majority of the time the momentum portfolio is under 50 stocks (out of 300) that trade above 10x P/S. The average number of firms within the momentum sample trading above 10x P/S is 44 firms (44 out of 300 = 14.67%). So, what happens if we include/exclude these firms from the momentum portfolios?
Results
To test the impact, we examine the returns of 3 momentum portfolios, and compare them to the market:
- US MOM – ALL FIRMS EW: Top quintile of momentum firms (300). Portfolio is equal-weighted.
- US MOM – EX-FIRMS > 10X P/S EW: Firms within the top quintile on momentum that are trading below 10x P/S. Portfolio is equal-weighted.
- US MOM – FIRMS > 10X P/S EW: Firms within the top quintile on momentum that are trading above 10x P/S. Portfolio is equal-weighted.
- SP500 INDEX: S&P 500 Index
All returns shown below are gross of any transaction fees and management fees.
The results are hypothetical results and are not an indicator of future results and do not represent returns that any investor actually attained. Indexes are unmanaged and do not reflect management or trading fees, and one cannot invest directly in an index. Please see a list of descriptions and a list of disclosures here.
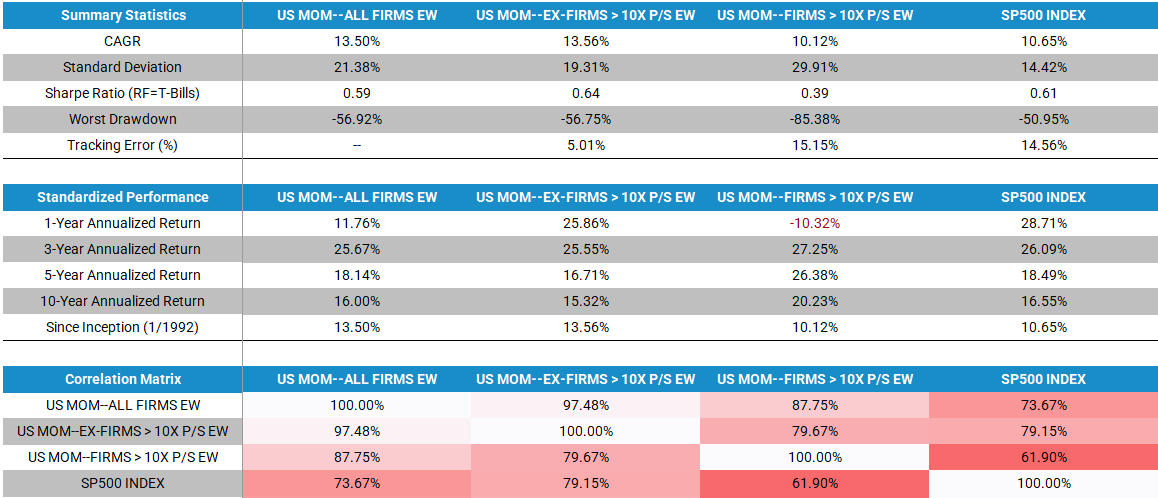
The results above highlight a few things:
- Comparing columns 1 and 2, we get the answer to the main question I was posed. Excluding momentum firms trading at 10x P/S has a marginal impact over the long-run (Jan. 1, 1992 - Dec. 31, 2021). There is only a 6 bps-a-year difference over the entire time period.
- Comparing columns 1 and 3, we see that building a momentum portfolio solely on stocks trading above 10x P/S is a bad idea (not surprising). One would lose ~ 3.5% annually compared to the simple momentum portfolio.
So, is excluding stocks trading above 10x P/S a horrible idea? No. There are time periods when there is a pretty large divergence in returns between the naïve momentum portfolio and the momentum portfolio excluding stocks above 10x P/S.
Below are the annual returns, with a few years highlighted:
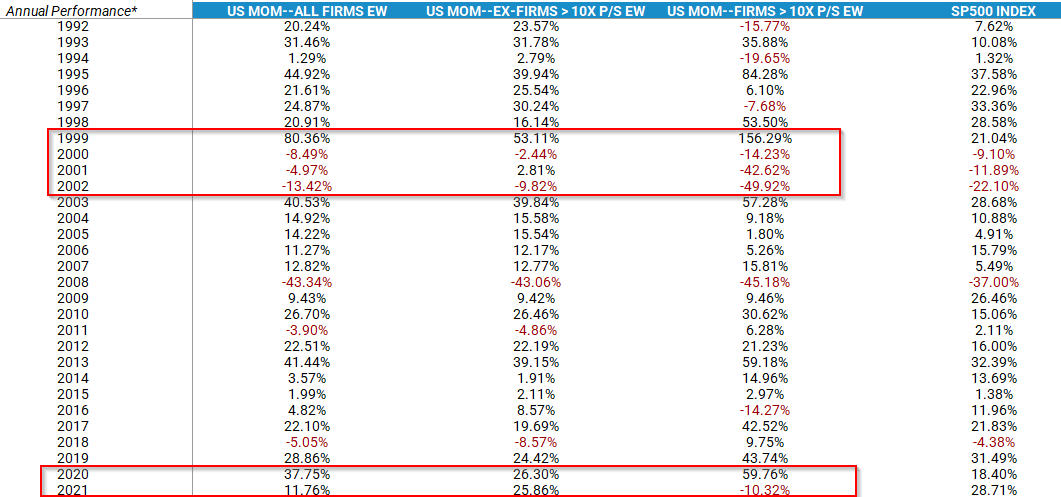
The results are hypothetical results and are not an indicator of future results and do not represent returns that any investor actually attained. Indexes are unmanaged and do not reflect management or trading fees, and one cannot invest directly in an index. Please see a list of descriptions and a list of disclosures here.
The annual returns above show that in the internet bubble and the post-COVID period, there were some pretty large divergences between the 3 momentum portfolios.
Summary
Overall, we see that excluding firms trading above 10x P/S has a minimal impact over the entire time sample (6 bps difference from 1992 to 2021). However, if one wanted to build a momentum portfolio and exclude these firms, it didn’t historically hurt performance.
However, as many know, momentum requires a lot of turnover (see here), which can cause tax issues if not done within an IRA or another tax-efficient wrapper (such as within an ETF).
Performance figures contained herein are hypothetical, unaudited and prepared by Alpha Architect, LLC; hypothetical results are intended for illustrative purposes only. Past performance is not ...
more

