
Mixed Outlooks For Four Big Banks Ahead Of Earnings
The first-quarter earnings season is set to kick off next week with the largest banks in the United States set to report. JPMorgan Chase (JPM) and Wells Fargo (WFC) are set to report on Wednesday, April 14, and Bank of America (BAC) and Citigroup (C) are set to report on Thursday, April 15.
Bank stocks have performed extremely well over the last few months as interest rates have been rising. When interest rates increase, bank margins improve as the gap between the interest received on loans increases more than the interest paid out on deposits. The rate on 10-year Treasuries jumped above 1.0% at the beginning of the year and continued to climb in the first quarter. The 10-year treasury rate is a key benchmark for loan rates.
With the rising interest rates boosting investor confidence in banks, the stocks of the four banks listed above have all seen significant jumps. From the beginning of February through April 6, the S&P 500 has increased approximately 10%. During that same time period Bank of America is up 34.5% and Wells Fargo is up 33.8%. Citigroup is up 25.2% and JPMorgan lags the others, but still gained 19.3%.
All four weekly charts show that the stocks are in overbought territory based on the 10-week RSI and the weekly stochastic indicators. Rather than show you all four charts, the chart for Bank of America is below. It is the one with the highest RSI of the four.
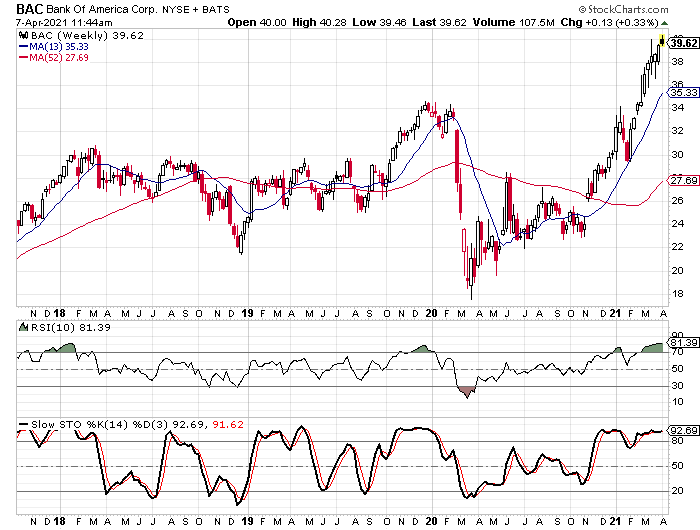
Bank of America’s stochastic indicators are also higher than the other three, but all four have readings above 80. All four stocks are also significantly above their 52-week moving averages as well.
Earnings are Expected to Improve Greatly Versus Last Year
Looking at the EPS estimates for each of the four companies, all four are expected to see great improvements in their earnings compared to Q1 of 2020. I put together the following table to show each company’s EPS estimate, the results from Q4 2020, and the results from Q1 2020. What we see is that Citigroup is the only one that is expected to see better earnings for Q1 than they did in Q4. The other three are expected to see slight declines on a quarter to quarter basis.

The results of Q1 2021 versus the results of Q1 2020 show that huge jumps are expected across the board. Of course, Wells Fargo’s expected growth is huge because the company was barely profitable last year. The company’s legal issues were taking a toll and the company’s fundamental ratings are much lower than the other three. Citigroup and JPMorgan are both expected to see jumps of 126% and 284%, respectively. Bank of America is the only one not expected to see earnings double, but 60% earnings growth isn’t too shabby.
If we look at Tickeron’s Scorecard Ratings for all four, Bank of America and JPMorgan both have “strong buy” ratings, Citigroup has a “buy” rating, and Wells Fargo has a “sell” rating.

The biggest difference between the stocks is in the fundamentals. We see that Wells Fargo has two positive ratings and four negative ratings. It is the only one with more negative ratings than positive ratings. Bank of America has four positive ratings and three negative ratings. JPMorgan has three positive and three negative ratings. Citigroup has three positive ratings and two negative ratings.
All four companies get positive marks in the Price Growth Rating and the P/E Growth Rating. Bank of America and JPMorgan both get positive ratings in the Profit vs. Risk Rating category. Bank of America gets is the only one that gets a positive rating from the Outlook Rating.

On the technical side, Citigroup and Wells Fargo both have two bullish signals and three bearish signals. JPMorgan gets two bullish signals and no bearish signals. Bank of America stands out once again with four bullish signals and not a single bearish signal.
The Sentiment Indicators are Similar for All Four
When it comes to how to stocks move after an earnings report, I find that sentiment and expectations play very key roles. If the sentiment is too bullish and the expectations are too high, the earnings report is an extremely high hurdle for the company to clear. If expectations and sentiment are low, it is easier for the company to beat and move higher.
In the case of these four companies, all of the sentiment indicators are very similar. The buy percentages from analysts (number of buy ratings as a percentage of the total) all fall in the 60% to 70% range. The average buy percentage falls in the 65% to 75% range so all four banks are in the average range—Bank of America and Wells Fargo’s buy percentages are a little below average.

The average short interest ratio falls in the 3.0 range historically. Since the big short squeezes happened back in January the average ratio seems to be a little lower than that, but all four of the banks have short interest ratios below 2.0 and that indicates slightly more bullish sentiment than the average stock.
Putting all of the factors together, the fundamentals, the technical analysis, and the sentiment indicators, I like Bank of America the best and have the most doubts about Wells Fargo. Bank of America scores better than the others in the fundamental screener and the technical analysis screener. Wells Fargo scores the worst in the fundamental screener.
Disclaimer: Although our services incorporate historical financial information, past financial performance is not a guarantee or indicator of future results. Moreover, although we believe the ...
more

